 Email
Email Print
Print


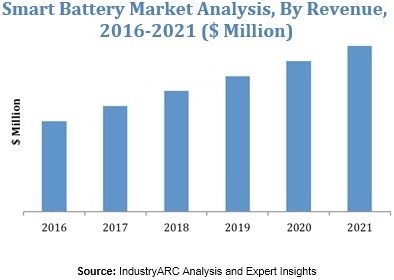
Smart Battery Market- By Type; By Application - Forecast(2024 - 2030)
There are several applications that are augmenting the growth of the smart battery market. With the growing awareness of the need to go green, the demand for battery operated vehicles is also increasing rapidly. Technological advances are bringing down the prices of electric vehicles and this is in turn driving the growth of the overall battery market. With the features that smart batteries have to offer, there is a clearly evident preference for them. These factors, coupled with the need to curb carbon emissions and the growth of the renewable energy sector are driving the growth of the smart battery market. This market is expected to exhibit a double digit growth rate till the end of the forecast period. One factor that needs to be addressed is the comparitively higher cost of smart batteries than the regular batteries. Once the price gap starts to narrow, the market has the potential to grow much faster.
A large amount of R&D is currently underway across the globe, not only by governments, but some of the major conglomerates as well.
The Smart Battery market can be segmented on the basis of type as
- Lead Acid, NiMH, NiCd, Zinc Carbon, Lithium Ion, Lithium Ion Polymer, Alkaline and Others
In terms of applications, the Smart Battery market has been segmented across the following
- Consumer Electronics, Healthcare, Aerospace & Defense, Automotive, Utilities and Others
The market has been segmented based on the following geographies
- North America, South America, APAC, Europe, Middle East and Africa
Following are just a few of the companies that are operating in the smart battery market.
- Accutronics Ltd, Trojan Battery Company, Cadex Electronics Inc., Rose Electronics Distributing Company, Inc.
List of Tables
Table 1 Smart Battery Market Overview 2023-2030
Table 2 Smart Battery Market Leader Analysis 2023-2030 (US$)
Table 3 Smart Battery MarketProduct Analysis 2023-2030 (US$)
Table 4 Smart Battery MarketEnd User Analysis 2023-2030 (US$)
Table 5 Smart Battery MarketPatent Analysis 2013-2023* (US$)
Table 6 Smart Battery MarketFinancial Analysis 2023-2030 (US$)
Table 7 Smart Battery Market Driver Analysis 2023-2030 (US$)
Table 8 Smart Battery MarketChallenges Analysis 2023-2030 (US$)
Table 9 Smart Battery MarketConstraint Analysis 2023-2030 (US$)
Table 10 Smart Battery Market Supplier Bargaining Power Analysis 2023-2030 (US$)
Table 11 Smart Battery Market Buyer Bargaining Power Analysis 2023-2030 (US$)
Table 12 Smart Battery Market Threat of Substitutes Analysis 2023-2030 (US$)
Table 13 Smart Battery Market Threat of New Entrants Analysis 2023-2030 (US$)
Table 14 Smart Battery Market Degree of Competition Analysis 2023-2030 (US$)
Table 15 Smart Battery MarketValue Chain Analysis 2023-2030 (US$)
Table 16 Smart Battery MarketPricing Analysis 2023-2030 (US$)
Table 17 Smart Battery MarketOpportunities Analysis 2023-2030 (US$)
Table 18 Smart Battery MarketProduct Life Cycle Analysis 2023-2030 (US$)
Table 19 Smart Battery MarketSupplier Analysis 2023-2030 (US$)
Table 20 Smart Battery MarketDistributor Analysis 2023-2030 (US$)
Table 21 Smart Battery Market Trend Analysis 2023-2030 (US$)
Table 22 Smart Battery Market Size 2023 (US$)
Table 23 Smart Battery Market Forecast Analysis 2023-2030 (US$)
Table 24 Smart Battery Market Sales Forecast Analysis 2023-2030 (Units)
Table 25 Smart Battery Market, Revenue & Volume,By Delivery Model, 2023-2030 ($)
Table 26 Smart Battery MarketBy Delivery Model, Revenue & Volume,By Lead acid, 2023-2030 ($)
Table 27 Smart Battery MarketBy Delivery Model, Revenue & Volume,By Nickel-metal hydride (NiMH), 2023-2030 ($)
Table 28 Smart Battery MarketBy Delivery Model, Revenue & Volume,By Nickel cadmium (NiCd), 2023-2030 ($)
Table 29 Smart Battery MarketBy Delivery Model, Revenue & Volume,By Zinc Carbon, 2023-2030 ($)
Table 30 Smart Battery MarketBy Delivery Model, Revenue & Volume,By Lithium Ion, 2023-2030 ($)
Table 31 Smart Battery Market, Revenue & Volume,By Application, 2023-2030 ($)
Table 32 Smart Battery MarketBy Application, Revenue & Volume,By Consumer Electronics, 2023-2030 ($)
Table 33 Smart Battery MarketBy Application, Revenue & Volume,By Aerospace & Defense, 2023-2030 ($)
Table 34 Smart Battery MarketBy Application, Revenue & Volume,By Healthcare, 2023-2030 ($)
Table 35 Smart Battery MarketBy Application, Revenue & Volume,By Industrial, 2023-2030 ($)
Table 36 Smart Battery MarketBy Application, Revenue & Volume,By Automotive, 2023-2030 ($)
Table 37 North America Smart Battery Market, Revenue & Volume,By Delivery Model, 2023-2030 ($)
Table 38 North America Smart Battery Market, Revenue & Volume,By Application, 2023-2030 ($)
Table 39 South america Smart Battery Market, Revenue & Volume,By Delivery Model, 2023-2030 ($)
Table 40 South america Smart Battery Market, Revenue & Volume,By Application, 2023-2030 ($)
Table 41 Europe Smart Battery Market, Revenue & Volume,By Delivery Model, 2023-2030 ($)
Table 42 Europe Smart Battery Market, Revenue & Volume,By Application, 2023-2030 ($)
Table 43 APAC Smart Battery Market, Revenue & Volume,By Delivery Model, 2023-2030 ($)
Table 44 APAC Smart Battery Market, Revenue & Volume,By Application, 2023-2030 ($)
Table 45 Middle East & Africa Smart Battery Market, Revenue & Volume,By Delivery Model, 2023-2030 ($)
Table 46 Middle East & Africa Smart Battery Market, Revenue & Volume,By Application, 2023-2030 ($)
Table 47 Russia Smart Battery Market, Revenue & Volume,By Delivery Model, 2023-2030 ($)
Table 48 Russia Smart Battery Market, Revenue & Volume,By Application, 2023-2030 ($)
Table 49 Israel Smart Battery Market, Revenue & Volume,By Delivery Model, 2023-2030 ($)
Table 50 Israel Smart Battery Market, Revenue & Volume,By Application, 2023-2030 ($)
Table 51 Top Companies 2023 (US$)Smart Battery Market, Revenue & Volume,,
Table 52 Product Launch 2023-2030Smart Battery Market, Revenue & Volume,,
Table 53 Mergers & Acquistions 2023-2030Smart Battery Market, Revenue & Volume,,
List of Figures
Figure 1 Overview of Smart Battery Market 2023-2030
Figure 2 Market Share Analysis for Smart Battery Market 2023 (US$)
Figure 3 Product Comparison in Smart Battery Market 2023-2030 (US$)
Figure 4 End User Profile for Smart Battery Market 2023-2030 (US$)
Figure 5 Patent Application and Grant in Smart Battery Market 2013-2023* (US$)
Figure 6 Top 5 Companies Financial Analysis in Smart Battery Market 2023-2030 (US$)
Figure 7 Market Entry Strategy in Smart Battery Market 2023-2030
Figure 8 Ecosystem Analysis in Smart Battery Market2023
Figure 9 Average Selling Price in Smart Battery Market 2023-2030
Figure 10 Top Opportunites in Smart Battery Market 2023-2030
Figure 11 Market Life Cycle Analysis in Smart Battery Market
Figure 12 GlobalBy Delivery ModelSmart Battery Market Revenue, 2023-2030 ($)
Figure 13 GlobalBy ApplicationSmart Battery Market Revenue, 2023-2030 ($)
Figure 14 Global Smart Battery Market - By Geography
Figure 15 Global Smart Battery Market Value & Volume, By Geography, 2023-2030 ($)
Figure 16 Global Smart Battery Market CAGR, By Geography, 2023-2030 (%)
Figure 17 North America Smart Battery Market Value & Volume, 2023-2030 ($)
Figure 18 US Smart Battery Market Value & Volume, 2023-2030 ($)
Figure 19 US GDP and Population, 2023-2030 ($)
Figure 20 US GDP – Composition of 2023, By Sector of Origin
Figure 21 US Export and Import Value & Volume, 2023-2030 ($)
Figure 22 Canada Smart Battery Market Value & Volume, 2023-2030 ($)
Figure 23 Canada GDP and Population, 2023-2030 ($)
Figure 24 Canada GDP – Composition of 2023, By Sector of Origin
Figure 25 Canada Export and Import Value & Volume, 2023-2030 ($)
Figure 26 Mexico Smart Battery Market Value & Volume, 2023-2030 ($)
Figure 27 Mexico GDP and Population, 2023-2030 ($)
Figure 28 Mexico GDP – Composition of 2023, By Sector of Origin
Figure 29 Mexico Export and Import Value & Volume, 2023-2030 ($)
Figure 30 South America Smart Battery MarketSouth America 3D Printing Market Value & Volume, 2023-2030 ($)
Figure 31 Brazil Smart Battery Market Value & Volume, 2023-2030 ($)
Figure 32 Brazil GDP and Population, 2023-2030 ($)
Figure 33 Brazil GDP – Composition of 2023, By Sector of Origin
Figure 34 Brazil Export and Import Value & Volume, 2023-2030 ($)
Figure 35 Venezuela Smart Battery Market Value & Volume, 2023-2030 ($)
Figure 36 Venezuela GDP and Population, 2023-2030 ($)
Figure 37 Venezuela GDP – Composition of 2023, By Sector of Origin
Figure 38 Venezuela Export and Import Value & Volume, 2023-2030 ($)
Figure 39 Argentina Smart Battery Market Value & Volume, 2023-2030 ($)
Figure 40 Argentina GDP and Population, 2023-2030 ($)
Figure 41 Argentina GDP – Composition of 2023, By Sector of Origin
Figure 42 Argentina Export and Import Value & Volume, 2023-2030 ($)
Figure 43 Ecuador Smart Battery Market Value & Volume, 2023-2030 ($)
Figure 44 Ecuador GDP and Population, 2023-2030 ($)
Figure 45 Ecuador GDP – Composition of 2023, By Sector of Origin
Figure 46 Ecuador Export and Import Value & Volume, 2023-2030 ($)
Figure 47 Peru Smart Battery Market Value & Volume, 2023-2030 ($)
Figure 48 Peru GDP and Population, 2023-2030 ($)
Figure 49 Peru GDP – Composition of 2023, By Sector of Origin
Figure 50 Peru Export and Import Value & Volume, 2023-2030 ($)
Figure 51 Colombia Smart Battery Market Value & Volume, 2023-2030 ($)
Figure 52 Colombia GDP and Population, 2023-2030 ($)
Figure 53 Colombia GDP – Composition of 2023, By Sector of Origin
Figure 54 Colombia Export and Import Value & Volume, 2023-2030 ($)
Figure 55 Costa Rica Smart Battery MarketCosta Rica 3D Printing Market Value & Volume, 2023-2030 ($)
Figure 56 Costa Rica GDP and Population, 2023-2030 ($)
Figure 57 Costa Rica GDP – Composition of 2023, By Sector of Origin
Figure 58 Costa Rica Export and Import Value & Volume, 2023-2030 ($)
Figure 59 Europe Smart Battery Market Value & Volume, 2023-2030 ($)
Figure 60 U.K Smart Battery Market Value & Volume, 2023-2030 ($)
Figure 61 U.K GDP and Population, 2023-2030 ($)
Figure 62 U.K GDP – Composition of 2023, By Sector of Origin
Figure 63 U.K Export and Import Value & Volume, 2023-2030 ($)
Figure 64 Germany Smart Battery Market Value & Volume, 2023-2030 ($)
Figure 65 Germany GDP and Population, 2023-2030 ($)
Figure 66 Germany GDP – Composition of 2023, By Sector of Origin
Figure 67 Germany Export and Import Value & Volume, 2023-2030 ($)
Figure 68 Italy Smart Battery Market Value & Volume, 2023-2030 ($)
Figure 69 Italy GDP and Population, 2023-2030 ($)
Figure 70 Italy GDP – Composition of 2023, By Sector of Origin
Figure 71 Italy Export and Import Value & Volume, 2023-2030 ($)
Figure 72 France Smart Battery Market Value & Volume, 2023-2030 ($)
Figure 73 France GDP and Population, 2023-2030 ($)
Figure 74 France GDP – Composition of 2023, By Sector of Origin
Figure 75 France Export and Import Value & Volume, 2023-2030 ($)
Figure 76 Netherlands Smart Battery Market Value & Volume, 2023-2030 ($)
Figure 77 Netherlands GDP and Population, 2023-2030 ($)
Figure 78 Netherlands GDP – Composition of 2023, By Sector of Origin
Figure 79 Netherlands Export and Import Value & Volume, 2023-2030 ($)
Figure 80 Belgium Smart Battery Market Value & Volume, 2023-2030 ($)
Figure 81 Belgium GDP and Population, 2023-2030 ($)
Figure 82 Belgium GDP – Composition of 2023, By Sector of Origin
Figure 83 Belgium Export and Import Value & Volume, 2023-2030 ($)
Figure 84 Spain Smart Battery Market Value & Volume, 2023-2030 ($)
Figure 85 Spain GDP and Population, 2023-2030 ($)
Figure 86 Spain GDP – Composition of 2023, By Sector of Origin
Figure 87 Spain Export and Import Value & Volume, 2023-2030 ($)
Figure 88 Denmark Smart Battery Market Value & Volume, 2023-2030 ($)
Figure 89 Denmark GDP and Population, 2023-2030 ($)
Figure 90 Denmark GDP – Composition of 2023, By Sector of Origin
Figure 91 Denmark Export and Import Value & Volume, 2023-2030 ($)
Figure 92 APAC Smart Battery Market Value & Volume, 2023-2030 ($)
Figure 93 China Smart Battery MarketValue & Volume, 2023-2030
Figure 94 China GDP and Population, 2023-2030 ($)
Figure 95 China GDP – Composition of 2023, By Sector of Origin
Figure 96 China Export and Import Value & Volume, 2023-2030 ($)Smart Battery MarketChina Export and Import Value & Volume, 2023-2030 ($)
Figure 97 Australia Smart Battery Market Value & Volume, 2023-2030 ($)
Figure 98 Australia GDP and Population, 2023-2030 ($)
Figure 99 Australia GDP – Composition of 2023, By Sector of Origin
Figure 100 Australia Export and Import Value & Volume, 2023-2030 ($)
Figure 101 South Korea Smart Battery Market Value & Volume, 2023-2030 ($)
Figure 102 South Korea GDP and Population, 2023-2030 ($)
Figure 103 South Korea GDP – Composition of 2023, By Sector of Origin
Figure 104 South Korea Export and Import Value & Volume, 2023-2030 ($)
Figure 105 India Smart Battery Market Value & Volume, 2023-2030 ($)
Figure 106 India GDP and Population, 2023-2030 ($)
Figure 107 India GDP – Composition of 2023, By Sector of Origin
Figure 108 India Export and Import Value & Volume, 2023-2030 ($)
Figure 109 Taiwan Smart Battery MarketTaiwan 3D Printing Market Value & Volume, 2023-2030 ($)
Figure 110 Taiwan GDP and Population, 2023-2030 ($)
Figure 111 Taiwan GDP – Composition of 2023, By Sector of Origin
Figure 112 Taiwan Export and Import Value & Volume, 2023-2030 ($)
Figure 113 Malaysia Smart Battery MarketMalaysia 3D Printing Market Value & Volume, 2023-2030 ($)
Figure 114 Malaysia GDP and Population, 2023-2030 ($)
Figure 115 Malaysia GDP – Composition of 2023, By Sector of Origin
Figure 116 Malaysia Export and Import Value & Volume, 2023-2030 ($)
Figure 117 Hong Kong Smart Battery MarketHong Kong 3D Printing Market Value & Volume, 2023-2030 ($)
Figure 118 Hong Kong GDP and Population, 2023-2030 ($)
Figure 119 Hong Kong GDP – Composition of 2023, By Sector of Origin
Figure 120 Hong Kong Export and Import Value & Volume, 2023-2030 ($)
Figure 121 Middle East & Africa Smart Battery MarketMiddle East & Africa 3D Printing Market Value & Volume, 2023-2030 ($)
Figure 122 Russia Smart Battery MarketRussia 3D Printing Market Value & Volume, 2023-2030 ($)
Figure 123 Russia GDP and Population, 2023-2030 ($)
Figure 124 Russia GDP – Composition of 2023, By Sector of Origin
Figure 125 Russia Export and Import Value & Volume, 2023-2030 ($)
Figure 126 Israel Smart Battery Market Value & Volume, 2023-2030 ($)
Figure 127 Israel GDP and Population, 2023-2030 ($)
Figure 128 Israel GDP – Composition of 2023, By Sector of Origin
Figure 129 Israel Export and Import Value & Volume, 2023-2030 ($)
Figure 130 Entropy Share, By Strategies, 2023-2030* (%)Smart Battery Market
Figure 131 Developments, 2023-2030*Smart Battery Market
Figure 132 Company 1 Smart Battery Market Net Revenue, By Years, 2023-2030* ($)
Figure 133 Company 1 Smart Battery Market Net Revenue Share, By Business segments, 2023 (%)
Figure 134 Company 1 Smart Battery Market Net Sales Share, By Geography, 2023 (%)
Figure 135 Company 2 Smart Battery Market Net Revenue, By Years, 2023-2030* ($)
Figure 136 Company 2 Smart Battery Market Net Revenue Share, By Business segments, 2023 (%)
Figure 137 Company 2 Smart Battery Market Net Sales Share, By Geography, 2023 (%)
Figure 138 Company 3Smart Battery Market Net Revenue, By Years, 2023-2030* ($)
Figure 139 Company 3Smart Battery Market Net Revenue Share, By Business segments, 2023 (%)
Figure 140 Company 3Smart Battery Market Net Sales Share, By Geography, 2023 (%)
Figure 141 Company 4 Smart Battery Market Net Revenue, By Years, 2023-2030* ($)
Figure 142 Company 4 Smart Battery Market Net Revenue Share, By Business segments, 2023 (%)
Figure 143 Company 4 Smart Battery Market Net Sales Share, By Geography, 2023 (%)
Figure 144 Company 5 Smart Battery Market Net Revenue, By Years, 2023-2030* ($)
Figure 145 Company 5 Smart Battery Market Net Revenue Share, By Business segments, 2023 (%)
Figure 146 Company 5 Smart Battery Market Net Sales Share, By Geography, 2023 (%)
Figure 147 Company 6 Smart Battery Market Net Revenue, By Years, 2023-2030* ($)
Figure 148 Company 6 Smart Battery Market Net Revenue Share, By Business segments, 2023 (%)
Figure 149 Company 6 Smart Battery Market Net Sales Share, By Geography, 2023 (%)
Figure 150 Company 7 Smart Battery Market Net Revenue, By Years, 2023-2030* ($)
Figure 151 Company 7 Smart Battery Market Net Revenue Share, By Business segments, 2023 (%)
Figure 152 Company 7 Smart Battery Market Net Sales Share, By Geography, 2023 (%)
Figure 153 Company 8 Smart Battery Market Net Revenue, By Years, 2023-2030* ($)
Figure 154 Company 8 Smart Battery Market Net Revenue Share, By Business segments, 2023 (%)
Figure 155 Company 8 Smart Battery Market Net Sales Share, By Geography, 2023 (%)
Figure 156 Company 9 Smart Battery Market Net Revenue, By Years, 2023-2030* ($)
Figure 157 Company 9 Smart Battery Market Net Revenue Share, By Business segments, 2023 (%)
Figure 158 Company 9 Smart Battery Market Net Sales Share, By Geography, 2023 (%)
Figure 159 Company 10 Smart Battery Market Net Revenue, By Years, 2023-2030* ($)
Figure 160 Company 10 Smart Battery Market Net Revenue Share, By Business segments, 2023 (%)
Figure 161 Company 10 Smart Battery Market Net Sales Share, By Geography, 2023 (%)
Figure 162 Company 11 Smart Battery Market Net Revenue, By Years, 2023-2030* ($)
Figure 163 Company 11 Smart Battery Market Net Revenue Share, By Business segments, 2023 (%)
Figure 164 Company 11 Smart Battery Market Net Sales Share, By Geography, 2023 (%)
Figure 165 Company 12 Smart Battery Market Net Revenue, By Years, 2023-2030* ($)
Figure 166 Company 12 Smart Battery Market Net Revenue Share, By Business segments, 2023 (%)
Figure 167 Company 12 Smart Battery Market Net Sales Share, By Geography, 2023 (%)
Figure 168 Company 13Smart Battery Market Net Revenue, By Years, 2023-2030* ($)
Figure 169 Company 13Smart Battery Market Net Revenue Share, By Business segments, 2023 (%)
Figure 170 Company 13Smart Battery Market Net Sales Share, By Geography, 2023 (%)
Figure 171 Company 14 Smart Battery Market Net Revenue, By Years, 2023-2030* ($)
Figure 172 Company 14 Smart Battery Market Net Revenue Share, By Business segments, 2023 (%)
Figure 173 Company 14 Smart Battery Market Net Sales Share, By Geography, 2023 (%)
Figure 174 Company 15 Smart Battery Market Net Revenue, By Years, 2023-2030* ($)
Figure 175 Company 15 Smart Battery Market Net Revenue Share, By Business segments, 2023 (%)
Figure 176 Company 15 Smart Battery Market Net Sales Share, By Geography, 2023 (%)