 Email
Email Print
Print


Smart Greenhouse Market- By Technology By Application - Forecast(2024 - 2030)
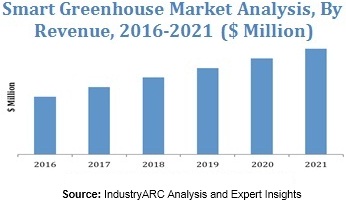
Smart Greenhouse Market Size is forecast to reach $ 6907.7 Million by 2030, at a CAGR of 10.20% during forecast period 2024-2030.Cultivation of crops under monitored and controlled environment is done in what is called a greenhouse. However, managing to do so without human intervention is what a smart greenhouse is capable of. Automation is making its way into practically everything around us and agriculture is not far behind. Smart greenhouses are increasingly being adopted to have more efficient cultivation methods in place. The growing global population is driving the need for such systems and is the reason why the smart greenhouse market will experience a robust growth rate during the forecast period considered in this report. A substantial amount of research and development is being conducted and funded by governments and universities across the globe to further the use of smart greenhouses.
The need for a high initial investment is one of the main inhibitors for the growth of the smart greenhouse market. Coupled with this is the fact that there is considerable amount of lack of awareness, especially in the under-developed and developing regions across the world. The smart greenhouse market is expected to cross $1.1 billion by the end of the forecast period.
A smart greenhouse requires an amalgamation of several different technologies. The Smart Greenhouse market can be segmented on the basis of technology
- Lighting System, Irrigation System, Communication System, Control System, HVAC System, Pumps, Material Handling Services, Climate Control Services and Others
In terms of applications, the Smart Greenhouse market has been segmented across the following
- Hydroponic and Non-hydroponic
Europe has been an early adopter of smart greenhouses and will maintain its largest share of the global smart greenhouse market throughout the forecast period. Regions such as Asia Pacific and the rest of the world are expected to witness a high growth rate owing to the increasing urbanization and the population explosion taking place in these regions.
- North America, South America, APAC, Europe, Middle East and Africa
Following are just a few of the companies that are operating in the smart greenhouse market.
- Nexus Coporation, Lumigrow Inc., Rough Brothers Inc., Argus Control System Ltd. and Heliospectra AB
Key Market Players:
The Top 5 companies in the Smart Greenhouse Market are:
- Priva
- Heliospectra
- DENSO Corporation
- Growlink, Inc.
- Netafim (Orbia)
For more Electronics Market reports, please click here
List of Tables
Table 1 Smart Greenhouse Market Overview 2023-2030
Table 2 Smart Greenhouse Market Leader Analysis 2023-2030 (US$)
Table 3 Smart Greenhouse MarketProduct Analysis 2023-2030 (US$)
Table 4 Smart Greenhouse MarketEnd User Analysis 2023-2030 (US$)
Table 5 Smart Greenhouse MarketPatent Analysis 2013-2023* (US$)
Table 6 Smart Greenhouse MarketFinancial Analysis 2023-2030 (US$)
Table 7 Smart Greenhouse Market Driver Analysis 2023-2030 (US$)
Table 8 Smart Greenhouse MarketChallenges Analysis 2023-2030 (US$)
Table 9 Smart Greenhouse MarketConstraint Analysis 2023-2030 (US$)
Table 10 Smart Greenhouse Market Supplier Bargaining Power Analysis 2023-2030 (US$)
Table 11 Smart Greenhouse Market Buyer Bargaining Power Analysis 2023-2030 (US$)
Table 12 Smart Greenhouse Market Threat of Substitutes Analysis 2023-2030 (US$)
Table 13 Smart Greenhouse Market Threat of New Entrants Analysis 2023-2030 (US$)
Table 14 Smart Greenhouse Market Degree of Competition Analysis 2023-2030 (US$)
Table 15 Smart Greenhouse MarketValue Chain Analysis 2023-2030 (US$)
Table 16 Smart Greenhouse MarketPricing Analysis 2023-2030 (US$)
Table 17 Smart Greenhouse MarketOpportunities Analysis 2023-2030 (US$)
Table 18 Smart Greenhouse MarketProduct Life Cycle Analysis 2023-2030 (US$)
Table 19 Smart Greenhouse MarketSupplier Analysis 2023-2030 (US$)
Table 20 Smart Greenhouse MarketDistributor Analysis 2023-2030 (US$)
Table 21 Smart Greenhouse Market Trend Analysis 2023-2030 (US$)
Table 22 Smart Greenhouse Market Size 2023 (US$)
Table 23 Smart Greenhouse Market Forecast Analysis 2023-2030 (US$)
Table 24 Smart Greenhouse Market Sales Forecast Analysis 2023-2030 (Units)
Table 25 Smart Greenhouse Market, Revenue & Volume,By Technology, 2023-2030 ($)
Table 26 Smart Greenhouse MarketBy Technology, Revenue & Volume,By Lighting System, 2023-2030 ($)
Table 27 Smart Greenhouse MarketBy Technology, Revenue & Volume,By Irrigation System, 2023-2030 ($)
Table 28 Smart Greenhouse MarketBy Technology, Revenue & Volume,By Communication System, 2023-2030 ($)
Table 29 Smart Greenhouse MarketBy Technology, Revenue & Volume,By Control System, 2023-2030 ($)
Table 30 Smart Greenhouse MarketBy Technology, Revenue & Volume,By HVAC System, 2023-2030 ($)
Table 31 Smart Greenhouse Market, Revenue & Volume,By Application, 2023-2030 ($)
Table 32 Smart Greenhouse MarketBy Application, Revenue & Volume,By Hydroponic, 2023-2030 ($)
Table 33 Smart Greenhouse MarketBy Application, Revenue & Volume,By Non-hydroponic, 2023-2030 ($)
Table 34 North America Smart Greenhouse Market, Revenue & Volume,By Technology, 2023-2030 ($)
Table 35 North America Smart Greenhouse Market, Revenue & Volume,By Application, 2023-2030 ($)
Table 36 South america Smart Greenhouse Market, Revenue & Volume,By Technology, 2023-2030 ($)
Table 37 South america Smart Greenhouse Market, Revenue & Volume,By Application, 2023-2030 ($)
Table 38 Europe Smart Greenhouse Market, Revenue & Volume,By Technology, 2023-2030 ($)
Table 39 Europe Smart Greenhouse Market, Revenue & Volume,By Application, 2023-2030 ($)
Table 40 APAC Smart Greenhouse Market, Revenue & Volume,By Technology, 2023-2030 ($)
Table 41 APAC Smart Greenhouse Market, Revenue & Volume,By Application, 2023-2030 ($)
Table 42 Middle East & Africa Smart Greenhouse Market, Revenue & Volume,By Technology, 2023-2030 ($)
Table 43 Middle East & Africa Smart Greenhouse Market, Revenue & Volume,By Application, 2023-2030 ($)
Table 44 Russia Smart Greenhouse Market, Revenue & Volume,By Technology, 2023-2030 ($)
Table 45 Russia Smart Greenhouse Market, Revenue & Volume,By Application, 2023-2030 ($)
Table 46 Israel Smart Greenhouse Market, Revenue & Volume,By Technology, 2023-2030 ($)
Table 47 Israel Smart Greenhouse Market, Revenue & Volume,By Application, 2023-2030 ($)
Table 48 Top Companies 2023 (US$)Smart Greenhouse Market, Revenue & Volume,,
Table 49 Product Launch 2023-2030Smart Greenhouse Market, Revenue & Volume,,
Table 50 Mergers & Acquistions 2023-2030Smart Greenhouse Market, Revenue & Volume,,
List of Figures
Figure 1 Overview of Smart Greenhouse Market 2023-2030
Figure 2 Market Share Analysis for Smart Greenhouse Market 2023 (US$)
Figure 3 Product Comparison in Smart Greenhouse Market 2023-2030 (US$)
Figure 4 End User Profile for Smart Greenhouse Market 2023-2030 (US$)
Figure 5 Patent Application and Grant in Smart Greenhouse Market 2013-2023* (US$)
Figure 6 Top 5 Companies Financial Analysis in Smart Greenhouse Market 2023-2030 (US$)
Figure 7 Market Entry Strategy in Smart Greenhouse Market 2023-2030
Figure 8 Ecosystem Analysis in Smart Greenhouse Market2023
Figure 9 Average Selling Price in Smart Greenhouse Market 2023-2030
Figure 10 Top Opportunites in Smart Greenhouse Market 2023-2030
Figure 11 Market Life Cycle Analysis in Smart Greenhouse Market
Figure 12 GlobalBy TechnologySmart Greenhouse Market Revenue, 2023-2030 ($)
Figure 13 GlobalBy ApplicationSmart Greenhouse Market Revenue, 2023-2030 ($)
Figure 14 Global Smart Greenhouse Market - By Geography
Figure 15 Global Smart Greenhouse Market Value & Volume, By Geography, 2023-2030 ($)
Figure 16 Global Smart Greenhouse Market CAGR, By Geography, 2023-2030 (%)
Figure 17 North America Smart Greenhouse Market Value & Volume, 2023-2030 ($)
Figure 18 US Smart Greenhouse Market Value & Volume, 2023-2030 ($)
Figure 19 US GDP and Population, 2023-2030 ($)
Figure 20 US GDP – Composition of 2023, By Sector of Origin
Figure 21 US Export and Import Value & Volume, 2023-2030 ($)
Figure 22 Canada Smart Greenhouse Market Value & Volume, 2023-2030 ($)
Figure 23 Canada GDP and Population, 2023-2030 ($)
Figure 24 Canada GDP – Composition of 2023, By Sector of Origin
Figure 25 Canada Export and Import Value & Volume, 2023-2030 ($)
Figure 26 Mexico Smart Greenhouse Market Value & Volume, 2023-2030 ($)
Figure 27 Mexico GDP and Population, 2023-2030 ($)
Figure 28 Mexico GDP – Composition of 2023, By Sector of Origin
Figure 29 Mexico Export and Import Value & Volume, 2023-2030 ($)
Figure 30 South America Smart Greenhouse MarketSouth America 3D Printing Market Value & Volume, 2023-2030 ($)
Figure 31 Brazil Smart Greenhouse Market Value & Volume, 2023-2030 ($)
Figure 32 Brazil GDP and Population, 2023-2030 ($)
Figure 33 Brazil GDP – Composition of 2023, By Sector of Origin
Figure 34 Brazil Export and Import Value & Volume, 2023-2030 ($)
Figure 35 Venezuela Smart Greenhouse Market Value & Volume, 2023-2030 ($)
Figure 36 Venezuela GDP and Population, 2023-2030 ($)
Figure 37 Venezuela GDP – Composition of 2023, By Sector of Origin
Figure 38 Venezuela Export and Import Value & Volume, 2023-2030 ($)
Figure 39 Argentina Smart Greenhouse Market Value & Volume, 2023-2030 ($)
Figure 40 Argentina GDP and Population, 2023-2030 ($)
Figure 41 Argentina GDP – Composition of 2023, By Sector of Origin
Figure 42 Argentina Export and Import Value & Volume, 2023-2030 ($)
Figure 43 Ecuador Smart Greenhouse Market Value & Volume, 2023-2030 ($)
Figure 44 Ecuador GDP and Population, 2023-2030 ($)
Figure 45 Ecuador GDP – Composition of 2023, By Sector of Origin
Figure 46 Ecuador Export and Import Value & Volume, 2023-2030 ($)
Figure 47 Peru Smart Greenhouse Market Value & Volume, 2023-2030 ($)
Figure 48 Peru GDP and Population, 2023-2030 ($)
Figure 49 Peru GDP – Composition of 2023, By Sector of Origin
Figure 50 Peru Export and Import Value & Volume, 2023-2030 ($)
Figure 51 Colombia Smart Greenhouse Market Value & Volume, 2023-2030 ($)
Figure 52 Colombia GDP and Population, 2023-2030 ($)
Figure 53 Colombia GDP – Composition of 2023, By Sector of Origin
Figure 54 Colombia Export and Import Value & Volume, 2023-2030 ($)
Figure 55 Costa Rica Smart Greenhouse MarketCosta Rica 3D Printing Market Value & Volume, 2023-2030 ($)
Figure 56 Costa Rica GDP and Population, 2023-2030 ($)
Figure 57 Costa Rica GDP – Composition of 2023, By Sector of Origin
Figure 58 Costa Rica Export and Import Value & Volume, 2023-2030 ($)
Figure 59 Europe Smart Greenhouse Market Value & Volume, 2023-2030 ($)
Figure 60 U.K Smart Greenhouse Market Value & Volume, 2023-2030 ($)
Figure 61 U.K GDP and Population, 2023-2030 ($)
Figure 62 U.K GDP – Composition of 2023, By Sector of Origin
Figure 63 U.K Export and Import Value & Volume, 2023-2030 ($)
Figure 64 Germany Smart Greenhouse Market Value & Volume, 2023-2030 ($)
Figure 65 Germany GDP and Population, 2023-2030 ($)
Figure 66 Germany GDP – Composition of 2023, By Sector of Origin
Figure 67 Germany Export and Import Value & Volume, 2023-2030 ($)
Figure 68 Italy Smart Greenhouse Market Value & Volume, 2023-2030 ($)
Figure 69 Italy GDP and Population, 2023-2030 ($)
Figure 70 Italy GDP – Composition of 2023, By Sector of Origin
Figure 71 Italy Export and Import Value & Volume, 2023-2030 ($)
Figure 72 France Smart Greenhouse Market Value & Volume, 2023-2030 ($)
Figure 73 France GDP and Population, 2023-2030 ($)
Figure 74 France GDP – Composition of 2023, By Sector of Origin
Figure 75 France Export and Import Value & Volume, 2023-2030 ($)
Figure 76 Netherlands Smart Greenhouse Market Value & Volume, 2023-2030 ($)
Figure 77 Netherlands GDP and Population, 2023-2030 ($)
Figure 78 Netherlands GDP – Composition of 2023, By Sector of Origin
Figure 79 Netherlands Export and Import Value & Volume, 2023-2030 ($)
Figure 80 Belgium Smart Greenhouse Market Value & Volume, 2023-2030 ($)
Figure 81 Belgium GDP and Population, 2023-2030 ($)
Figure 82 Belgium GDP – Composition of 2023, By Sector of Origin
Figure 83 Belgium Export and Import Value & Volume, 2023-2030 ($)
Figure 84 Spain Smart Greenhouse Market Value & Volume, 2023-2030 ($)
Figure 85 Spain GDP and Population, 2023-2030 ($)
Figure 86 Spain GDP – Composition of 2023, By Sector of Origin
Figure 87 Spain Export and Import Value & Volume, 2023-2030 ($)
Figure 88 Denmark Smart Greenhouse Market Value & Volume, 2023-2030 ($)
Figure 89 Denmark GDP and Population, 2023-2030 ($)
Figure 90 Denmark GDP – Composition of 2023, By Sector of Origin
Figure 91 Denmark Export and Import Value & Volume, 2023-2030 ($)
Figure 92 APAC Smart Greenhouse Market Value & Volume, 2023-2030 ($)
Figure 93 China Smart Greenhouse MarketValue & Volume, 2023-2030
Figure 94 China GDP and Population, 2023-2030 ($)
Figure 95 China GDP – Composition of 2023, By Sector of Origin
Figure 96 China Export and Import Value & Volume, 2023-2030 ($)Smart Greenhouse MarketChina Export and Import Value & Volume, 2023-2030 ($)
Figure 97 Australia Smart Greenhouse Market Value & Volume, 2023-2030 ($)
Figure 98 Australia GDP and Population, 2023-2030 ($)
Figure 99 Australia GDP – Composition of 2023, By Sector of Origin
Figure 100 Australia Export and Import Value & Volume, 2023-2030 ($)
Figure 101 South Korea Smart Greenhouse Market Value & Volume, 2023-2030 ($)
Figure 102 South Korea GDP and Population, 2023-2030 ($)
Figure 103 South Korea GDP – Composition of 2023, By Sector of Origin
Figure 104 South Korea Export and Import Value & Volume, 2023-2030 ($)
Figure 105 India Smart Greenhouse Market Value & Volume, 2023-2030 ($)
Figure 106 India GDP and Population, 2023-2030 ($)
Figure 107 India GDP – Composition of 2023, By Sector of Origin
Figure 108 India Export and Import Value & Volume, 2023-2030 ($)
Figure 109 Taiwan Smart Greenhouse MarketTaiwan 3D Printing Market Value & Volume, 2023-2030 ($)
Figure 110 Taiwan GDP and Population, 2023-2030 ($)
Figure 111 Taiwan GDP – Composition of 2023, By Sector of Origin
Figure 112 Taiwan Export and Import Value & Volume, 2023-2030 ($)
Figure 113 Malaysia Smart Greenhouse MarketMalaysia 3D Printing Market Value & Volume, 2023-2030 ($)
Figure 114 Malaysia GDP and Population, 2023-2030 ($)
Figure 115 Malaysia GDP – Composition of 2023, By Sector of Origin
Figure 116 Malaysia Export and Import Value & Volume, 2023-2030 ($)
Figure 117 Hong Kong Smart Greenhouse MarketHong Kong 3D Printing Market Value & Volume, 2023-2030 ($)
Figure 118 Hong Kong GDP and Population, 2023-2030 ($)
Figure 119 Hong Kong GDP – Composition of 2023, By Sector of Origin
Figure 120 Hong Kong Export and Import Value & Volume, 2023-2030 ($)
Figure 121 Middle East & Africa Smart Greenhouse MarketMiddle East & Africa 3D Printing Market Value & Volume, 2023-2030 ($)
Figure 122 Russia Smart Greenhouse MarketRussia 3D Printing Market Value & Volume, 2023-2030 ($)
Figure 123 Russia GDP and Population, 2023-2030 ($)
Figure 124 Russia GDP – Composition of 2023, By Sector of Origin
Figure 125 Russia Export and Import Value & Volume, 2023-2030 ($)
Figure 126 Israel Smart Greenhouse Market Value & Volume, 2023-2030 ($)
Figure 127 Israel GDP and Population, 2023-2030 ($)
Figure 128 Israel GDP – Composition of 2023, By Sector of Origin
Figure 129 Israel Export and Import Value & Volume, 2023-2030 ($)
Figure 130 Entropy Share, By Strategies, 2023-2030* (%)Smart Greenhouse Market
Figure 131 Developments, 2023-2030*Smart Greenhouse Market
Figure 132 Company 1 Smart Greenhouse Market Net Revenue, By Years, 2023-2030* ($)
Figure 133 Company 1 Smart Greenhouse Market Net Revenue Share, By Business segments, 2023 (%)
Figure 134 Company 1 Smart Greenhouse Market Net Sales Share, By Geography, 2023 (%)
Figure 135 Company 2 Smart Greenhouse Market Net Revenue, By Years, 2023-2030* ($)
Figure 136 Company 2 Smart Greenhouse Market Net Revenue Share, By Business segments, 2023 (%)
Figure 137 Company 2 Smart Greenhouse Market Net Sales Share, By Geography, 2023 (%)
Figure 138 Company 3Smart Greenhouse Market Net Revenue, By Years, 2023-2030* ($)
Figure 139 Company 3Smart Greenhouse Market Net Revenue Share, By Business segments, 2023 (%)
Figure 140 Company 3Smart Greenhouse Market Net Sales Share, By Geography, 2023 (%)
Figure 141 Company 4 Smart Greenhouse Market Net Revenue, By Years, 2023-2030* ($)
Figure 142 Company 4 Smart Greenhouse Market Net Revenue Share, By Business segments, 2023 (%)
Figure 143 Company 4 Smart Greenhouse Market Net Sales Share, By Geography, 2023 (%)
Figure 144 Company 5 Smart Greenhouse Market Net Revenue, By Years, 2023-2030* ($)
Figure 145 Company 5 Smart Greenhouse Market Net Revenue Share, By Business segments, 2023 (%)
Figure 146 Company 5 Smart Greenhouse Market Net Sales Share, By Geography, 2023 (%)
Figure 147 Company 6 Smart Greenhouse Market Net Revenue, By Years, 2023-2030* ($)
Figure 148 Company 6 Smart Greenhouse Market Net Revenue Share, By Business segments, 2023 (%)
Figure 149 Company 6 Smart Greenhouse Market Net Sales Share, By Geography, 2023 (%)
Figure 150 Company 7 Smart Greenhouse Market Net Revenue, By Years, 2023-2030* ($)
Figure 151 Company 7 Smart Greenhouse Market Net Revenue Share, By Business segments, 2023 (%)
Figure 152 Company 7 Smart Greenhouse Market Net Sales Share, By Geography, 2023 (%)
Figure 153 Company 8 Smart Greenhouse Market Net Revenue, By Years, 2023-2030* ($)
Figure 154 Company 8 Smart Greenhouse Market Net Revenue Share, By Business segments, 2023 (%)
Figure 155 Company 8 Smart Greenhouse Market Net Sales Share, By Geography, 2023 (%)
Figure 156 Company 9 Smart Greenhouse Market Net Revenue, By Years, 2023-2030* ($)
Figure 157 Company 9 Smart Greenhouse Market Net Revenue Share, By Business segments, 2023 (%)
Figure 158 Company 9 Smart Greenhouse Market Net Sales Share, By Geography, 2023 (%)
Figure 159 Company 10 Smart Greenhouse Market Net Revenue, By Years, 2023-2030* ($)
Figure 160 Company 10 Smart Greenhouse Market Net Revenue Share, By Business segments, 2023 (%)
Figure 161 Company 10 Smart Greenhouse Market Net Sales Share, By Geography, 2023 (%)
Figure 162 Company 11 Smart Greenhouse Market Net Revenue, By Years, 2023-2030* ($)
Figure 163 Company 11 Smart Greenhouse Market Net Revenue Share, By Business segments, 2023 (%)
Figure 164 Company 11 Smart Greenhouse Market Net Sales Share, By Geography, 2023 (%)
Figure 165 Company 12 Smart Greenhouse Market Net Revenue, By Years, 2023-2030* ($)
Figure 166 Company 12 Smart Greenhouse Market Net Revenue Share, By Business segments, 2023 (%)
Figure 167 Company 12 Smart Greenhouse Market Net Sales Share, By Geography, 2023 (%)
Figure 168 Company 13Smart Greenhouse Market Net Revenue, By Years, 2023-2030* ($)
Figure 169 Company 13Smart Greenhouse Market Net Revenue Share, By Business segments, 2023 (%)
Figure 170 Company 13Smart Greenhouse Market Net Sales Share, By Geography, 2023 (%)
Figure 171 Company 14 Smart Greenhouse Market Net Revenue, By Years, 2023-2030* ($)
Figure 172 Company 14 Smart Greenhouse Market Net Revenue Share, By Business segments, 2023 (%)
Figure 173 Company 14 Smart Greenhouse Market Net Sales Share, By Geography, 2023 (%)
Figure 174 Company 15 Smart Greenhouse Market Net Revenue, By Years, 2023-2030* ($)
Figure 175 Company 15 Smart Greenhouse Market Net Revenue Share, By Business segments, 2023 (%)
Figure 176 Company 15 Smart Greenhouse Market Net Sales Share, By Geography, 2023 (%)