 Email
Email Print
Print


GLV Display Technology Market- By Application ; By Geography With Forecast Period (2024 - 2030)
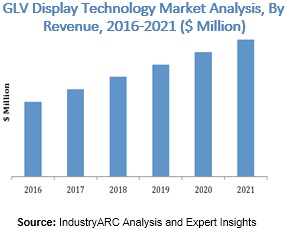
GLV Display Technology Market Size is forecast to reach $ 213.18 Million by 2030, at a CAGR of 3.80% during forecast period 2024-2030.Grating Light Valve (GLV) is a technology that works on the principal of dynamic adjustable diffration grating. Pixels are created from ribbon like structures on a silicon wafer. These structures are held under tension over a thin air gap and are allowed to move vertically. Deflection of the ribbons causes diffraction of incident light and controlling the ratio of diffraction to reflection is what makes GLV suitable for applications such as imaging, displays and projection. GLV was first discovered at Stanford University in California. The inventors named the company Silicon Light Machines to further develop and commercialize the technology. This company was later bought by Dainippon Screen Manufacturing Co., Ltd. and now is a wholly owned by the latter.
This technology has several unique performance advantages as compared to spatial light modulator technologies and these include rapid swithcing speeds, ability to withstand high opticcal power densities, among others. Such features can be leveraged for developing advanced projection display architectures that turn out to be more cost effective that conventional projection display systems that are currently available in the market. GLV is poised to be the latest solution for the imaging industry that offers high quality display systems.
There is a considerable amount of research and development currently underway at Universities, Research Institutes and Company R&D facilities across the globe and this could potentially further augment the GLV Display Technology market. High initial costs that are typically associated with new and upcoming technologies are expected to initially hinder the growth of this market.
Automotive displays constitute the fastest growing segment for the GLV display technology owing to the benefits the technology offers coupled with the suitability for automotive application requirements.
In terms of applications, the GLV Display Technology market has been segmented across the following:
- Displays
- Projectors
- Head-up Displays
- Automotive Displays
- Others
North America and Europe currently hold the top positions in this market and will continue to do so till the end of the forecast period considered in this report. Given how niche the technology currently is, it will take a few years for mass commercialization of products. Once that happens, the growth opportunities for GLV display technology are limitless.
The market has been segmented based on the following geographies:
- North America
- South America
- APAC
- Europe
- Middle East
- Africa
Following are just a few of the companies that are operating in the GLV Display Technology market:
- Dainippon Screen Manufacturing Co., Ltd
- Sony Corporation
Key Market Players:
The Top 5 companies in the GLV Display Technology Market are:
- Holoeye AG
- Hamamatsu Photonics K.K.
- Santec Corporation
- Elo Touch Solutions, Inc.
- Shoei Electronic Materials, inc.
For more Electronics Market reports, please click here
1. GLV Display Technology Market - Overview
1.1. Definitions and Scope
2. GLV Display Technology Market - Executive summary
2.1. Market Revenue, Market Size and Key Trends by Company
2.2. Key Trends by type of Application
2.3. Key Trends segmented by Geography
3. GLV Display Technology Market
3.1. Comparative analysis
3.1.1. Product Benchmarking - Top 10 companies
3.1.2. Top 5 Financials Analysis
3.1.3. Market Value split by Top 10 companies
3.1.4. Patent Analysis - Top 10 companies
3.1.5. Pricing Analysis
4. GLV Display Technology Market – Startup companies Scenario Premium
4.1. Top 10 startup company Analysis by
4.1.1. Investment
4.1.2. Revenue
4.1.3. Market Shares
4.1.4. Market Size and Application Analysis
4.1.5. Venture Capital and Funding Scenario
5. GLV Display Technology Market – Industry Market Entry Scenario Premium
5.1. Regulatory Framework Overview
5.2. New Business and Ease of Doing business index
5.3. Case studies of successful ventures
5.4. Customer Analysis – Top 10 companies
6. GLV Display Technology Market Forces
6.1. Drivers
6.2. Constraints
6.3. Challenges
6.4. Porters five force model
6.4.1. Bargaining power of suppliers
6.4.2. Bargaining powers of customers
6.4.3. Threat of new entrants
6.4.4. Rivalry among existing players
6.4.5. Threat of substitutes
7. GLV Display Technology Market -Strategic analysis
7.1. Value chain analysis
7.2. Opportunities analysis
7.3. Product life cycle
7.4. Suppliers and distributors Market Share
8. GLV Display Technology Market – By Application (Market Size -$Million / $Billion)
8.1. Market Size and Market Share Analysis
8.2. Application Revenue and Trend Research
8.3. Product Segment Analysis
8.3.1. Displays
8.3.2. Projectors
8.3.3. Head-up Displays
8.3.4. Automotive Displays
8.3.5. Others
9. GLV Display Technology - By Geography (Market Size -$Million / $Billion)
9.1. GLV Display Technology Market - North America Segment Research
9.2. North America Market Research (Million / $Billion)
9.2.1. Segment type Size and Market Size Analysis
9.2.2. Revenue and Trends
9.2.3. Application Revenue and Trends by type of Application
9.2.4. Company Revenue and Product Analysis
9.2.5. North America Product type and Application Market Size
9.2.5.1. U.S.
9.2.5.2. Canada
9.2.5.3. Mexico
9.2.5.4. Rest of North America
9.3. GLV Display Technology - South America Segment Research
9.4. South America Market Research (Market Size -$Million / $Billion)
9.4.1. Segment type Size and Market Size Analysis
9.4.2. Revenue and Trends
9.4.3. Application Revenue and Trends by type of Application
9.4.4. Company Revenue and Product Analysis
9.4.5. South America Product type and Application Market Size
9.4.5.1. Brazil
9.4.5.2. Venezuela
9.4.5.3. Argentina
9.4.5.4. Ecuador
9.4.5.5. Peru
9.4.5.6. Colombia
9.4.5.7. Costa Rica
9.4.5.8. Rest of South America
9.5. GLV Display Technology - Europe Segment Research
9.6. Europe Market Research (Market Size -$Million / $Billion)
9.6.1. Segment type Size and Market Size Analysis
9.6.2. Revenue and Trends
9.6.3. Application Revenue and Trends by type of Application
9.6.4. Company Revenue and Product Analysis
9.6.5. Europe Segment Product type and Application Market Size
9.6.5.1. U.K
9.6.5.2. Germany
9.6.5.3. Italy
9.6.5.4. France
9.6.5.5. Netherlands
9.6.5.6. Belgium
9.6.5.7. Spain
9.6.5.8. Denmark
9.6.5.9. Rest of Europe
9.7. GLV Display Technology – APAC Segment Research
9.8. APAC Market Research (Market Size -$Million / $Billion)
9.8.1. Segment type Size and Market Size Analysis
9.8.2. Revenue and Trends
9.8.3. Application Revenue and Trends by type of Application
9.8.4. Company Revenue and Product Analysis
9.8.5. APAC Segment – Product type and Application Market Size
9.8.5.1. China
9.8.5.2. Australia
9.8.5.3. Japan
9.8.5.4. South Korea
9.8.5.5. India
9.8.5.6. Taiwan
9.8.5.7. Malaysia
10. GLV Display Technology Market - Entropy
10.1. New product launches
10.2. M&A's, collaborations, JVs and partnerships
11. GLV Display Technology Market – Industry / Segment Competition landscape Premium
11.1. Market Share Analysis
11.1.1. Market Share by Country- Top companies
11.1.2. Market Share by Region- Top 10 companies
11.1.3. Market Share by type of Application – Top 10 companies
11.1.4. Market Share by type of Product / Product category- Top 10 companies
11.1.5. Market Share at global level- Top 10 companies
11.1.6. Best Practises for companies
12. GLV Display Technology Market – Key Company List by Country Premium
13. GLV Display Technology Market Company Analysis
13.1. Market Share, Company Revenue, Products, M&A, Developments
13.2. Dainippon Screen Manufacturing Co., Ltd
13.3. Sony Corporation
13.4. Hamamatsu Photonics K.K
13.5. Santec Corporation
13.6. Elo Touch Solutions, Inc.
"*Financials would be provided on a best efforts basis for private companies"
14. GLV Display Technology Market -Appendix
14.1. Abbreviations
14.2. Sources
15. GLV Display Technology Market -Methodology Premium
15.1. Research Methodology
15.1.1. Company Expert Interviews
15.1.2. Industry Databases
15.1.3. Associations
15.1.4. Company News
15.1.5. Company Annual Reports
15.1.6. Application Trends
15.1.7. New Products and Product database
15.1.8. Company Transcripts
15.1.9. R&D Trends
15.1.10. Key Opinion Leaders Interviews
15.1.11. Supply and Demand Trends
List of Tables
Table 1: GLV Display Technology Market Overview 2023-2030
Table 2: GLV Display Technology Market Leader Analysis 2023-2030 (US$)
Table 3: GLV Display Technology Market Product Analysis 2023-2030 (US$)
Table 4: GLV Display Technology Market End User Analysis 2023-2030 (US$)
Table 5: GLV Display Technology Market Patent Analysis 2013-2023* (US$)
Table 6: GLV Display Technology Market Financial Analysis 2023-2030 (US$)
Table 7: GLV Display Technology Market Driver Analysis 2023-2030 (US$)
Table 8: GLV Display Technology Market Challenges Analysis 2023-2030 (US$)
Table 9: GLV Display Technology Market Constraint Analysis 2023-2030 (US$)
Table 10: GLV Display Technology Market Supplier Bargaining Power Analysis 2023-2030 (US$)
Table 11: GLV Display Technology Market Buyer Bargaining Power Analysis 2023-2030 (US$)
Table 12: GLV Display Technology Market Threat of Substitutes Analysis 2023-2030 (US$)
Table 13: GLV Display Technology Market Threat of New Entrants Analysis 2023-2030 (US$)
Table 14: GLV Display Technology Market Degree of Competition Analysis 2023-2030 (US$)
Table 15: GLV Display Technology Market Value Chain Analysis 2023-2030 (US$)
Table 16: GLV Display Technology Market Pricing Analysis 2023-2030 (US$)
Table 17: GLV Display Technology Market Opportunities Analysis 2023-2030 (US$)
Table 18: GLV Display Technology Market Product Life Cycle Analysis 2023-2030 (US$)
Table 19: GLV Display Technology Market Supplier Analysis 2023-2030 (US$)
Table 20: GLV Display Technology Market Distributor Analysis 2023-2030 (US$)
Table 21: GLV Display Technology Market Trend Analysis 2023-2030 (US$)
Table 22: GLV Display Technology Market Size 2023 (US$)
Table 23: GLV Display Technology Market Forecast Analysis 2023-2030 (US$)
Table 24: GLV Display Technology Market Sales Forecast Analysis 2023-2030 (Units)
Table 25: GLV Display Technology Market, Revenue & Volume,By Application, 2023-2030 ($)
Table 26: GLV Display Technology Market By Application, Revenue & Volume,By Displays, 2023-2030 ($)
Table 27: GLV Display Technology Market By Application, Revenue & Volume,By Projectors, 2023-2030 ($)
Table 28: GLV Display Technology Market By Application, Revenue & Volume,By Head-up Displays, 2023-2030 ($)
Table 29: GLV Display Technology Market By Application, Revenue & Volume,By Automotive Displays, 2023-2030 ($)
Table 30: GLV Display Technology Market By Application, Revenue & Volume,By Application 5, 2023-2030 ($)
Table 31: North America GLV Display Technology Market, Revenue & Volume,By Application, 2023-2030 ($)
Table 32: South america GLV Display Technology Market, Revenue & Volume,By Application, 2023-2030 ($)
Table 33: Europe GLV Display Technology Market, Revenue & Volume,By Application, 2023-2030 ($)
Table 34: APAC GLV Display Technology Market, Revenue & Volume,By Application, 2023-2030 ($)
Table 35: Middle East & Africa GLV Display Technology Market, Revenue & Volume,By Application, 2023-2030 ($)
Table 36: Russia GLV Display Technology Market, Revenue & Volume,By Application, 2023-2030 ($)
Table 37: Israel GLV Display Technology Market, Revenue & Volume,By Application, 2023-2030 ($)
Table 38: Top Companies 2023 (US$)GLV Display Technology Market, Revenue & Volume
Table 39: Product Launch 2023-2030GLV Display Technology Market, Revenue & Volume
Table 40: Mergers & Acquistions 2023-2030GLV Display Technology Market, Revenue & Volume
List of Figures
Figure 1: Overview of GLV Display Technology Market 2023-2030
Figure 2: Market Share Analysis for GLV Display Technology Market 2023 (US$)
Figure 3: Product Comparison in GLV Display Technology Market 2023-2030 (US$)
Figure 4: End User Profile for GLV Display Technology Market 2023-2030 (US$)
Figure 5: Patent Application and Grant in GLV Display Technology Market 2013-2023* (US$)
Figure 6: Top 5 Companies Financial Analysis in GLV Display Technology Market 2023-2030 (US$)
Figure 7: Market Entry Strategy in GLV Display Technology Market 2023-2030
Figure 8: Ecosystem Analysis in GLV Display Technology Market 2023
Figure 9: Average Selling Price in GLV Display Technology Market 2023-2030
Figure 10: Top Opportunites in GLV Display Technology Market 2023-2030
Figure 11: Market Life Cycle Analysis in GLV Display Technology Market
Figure 12: GlobalBy ApplicationGLV Display Technology Market Revenue, 2023-2030 ($)
Figure 13: Global GLV Display Technology Market - By Geography
Figure 14: Global GLV Display Technology Market Value & Volume, By Geography, 2023-2030 ($)
Figure 15: Global GLV Display Technology Market CAGR, By Geography, 2023-2030 (%)
Figure 16: North America GLV Display Technology Market Value & Volume, 2023-2030 ($)
Figure 17: US GLV Display Technology Market Value & Volume, 2023-2030 ($)
Figure 18: US GDP and Population, 2023-2030 ($)
Figure 19: US GDP – Composition of 2023, By Sector of Origin
Figure 20: US Export and Import Value & Volume, 2023-2030 ($)
Figure 21: Canada GLV Display Technology Market Value & Volume, 2023-2030 ($)
Figure 22: Canada GDP and Population, 2023-2030 ($)
Figure 23: Canada GDP – Composition of 2023, By Sector of Origin
Figure 24: Canada Export and Import Value & Volume, 2023-2030 ($)
Figure 25: Mexico GLV Display Technology Market Value & Volume, 2023-2030 ($)
Figure 26: Mexico GDP and Population, 2023-2030 ($)
Figure 27: Mexico GDP – Composition of 2023, By Sector of Origin
Figure 28: Mexico Export and Import Value & Volume, 2023-2030 ($)
Figure 29: South America GLV Display Technology Market Value & Volume, 2023-2030 ($)
Figure 30: Brazil GLV Display Technology Market Value & Volume, 2023-2030 ($)
Figure 31: Brazil GDP and Population, 2023-2030 ($)
Figure 32: Brazil GDP – Composition of 2023, By Sector of Origin
Figure 33: Brazil Export and Import Value & Volume, 2023-2030 ($)
Figure 34: Venezuela GLV Display Technology Market Value & Volume, 2023-2030 ($)
Figure 35: Venezuela GDP and Population, 2023-2030 ($)
Figure 36: Venezuela GDP – Composition of 2023, By Sector of Origin
Figure 37: Venezuela Export and Import Value & Volume, 2023-2030 ($)
Figure 38: Argentina GLV Display Technology Market Value & Volume, 2023-2030 ($)
Figure 39: Argentina GDP and Population, 2023-2030 ($)
Figure 40: Argentina GDP – Composition of 2023, By Sector of Origin
Figure 41: Argentina Export and Import Value & Volume, 2023-2030 ($)
Figure 42: Ecuador GLV Display Technology Market Value & Volume, 2023-2030 ($)
Figure 43: Ecuador GDP and Population, 2023-2030 ($)
Figure 44: Ecuador GDP – Composition of 2023, By Sector of Origin
Figure 45: Ecuador Export and Import Value & Volume, 2023-2030 ($)
Figure 46: Peru GLV Display Technology Market Value & Volume, 2023-2030 ($)
Figure 47: Peru GDP and Population, 2023-2030 ($)
Figure 48: Peru GDP – Composition of 2023, By Sector of Origin
Figure 49: Peru Export and Import Value & Volume, 2023-2030 ($)
Figure 50: Colombia GLV Display Technology Market Value & Volume, 2023-2030 ($)
Figure 51: Colombia GDP and Population, 2023-2030 ($)
Figure 52: Colombia GDP – Composition of 2023, By Sector of Origin
Figure 53: Colombia Export and Import Value & Volume, 2023-2030 ($)
Figure 54: Costa Rica GLV Display Technology Market Value & Volume, 2023-2030 ($)
Figure 55: Costa Rica GDP and Population, 2023-2030 ($)
Figure 56: Costa Rica GDP – Composition of 2023, By Sector of Origin
Figure 57: Costa Rica Export and Import Value & Volume, 2023-2030 ($)
Figure 58: Europe GLV Display Technology Market Value & Volume, 2023-2030 ($)
Figure 59: U.K GLV Display Technology Market Value & Volume, 2023-2030 ($)
Figure 60: U.K GDP and Population, 2023-2030 ($)
Figure 61: U.K GDP – Composition of 2023, By Sector of Origin
Figure 62: U.K Export and Import Value & Volume, 2023-2030 ($)
Figure 63: Germany GLV Display Technology Market Value & Volume, 2023-2030 ($)
Figure 64: Germany GDP and Population, 2023-2030 ($)
Figure 65: Germany GDP – Composition of 2023, By Sector of Origin
Figure 66: Germany Export and Import Value & Volume, 2023-2030 ($)
Figure 67: Italy GLV Display Technology Market Value & Volume, 2023-2030 ($)
Figure 68: Italy GDP and Population, 2023-2030 ($)
Figure 69: Italy GDP – Composition of 2023, By Sector of Origin
Figure 70: Italy Export and Import Value & Volume, 2023-2030 ($)
Figure 71: France GLV Display Technology Market Value & Volume, 2023-2030 ($)
Figure 72: France GDP and Population, 2023-2030 ($)
Figure 73: France GDP – Composition of 2023, By Sector of Origin
Figure 74: France Export and Import Value & Volume, 2023-2030 ($)
Figure 75: Netherlands GLV Display Technology Market Value & Volume, 2023-2030 ($)
Figure 76: Netherlands GDP and Population, 2023-2030 ($)
Figure 77: Netherlands GDP – Composition of 2023, By Sector of Origin
Figure 78: Netherlands Export and Import Value & Volume, 2023-2030 ($)
Figure 79: Belgium GLV Display Technology Market Value & Volume, 2023-2030 ($)
Figure 80: Belgium GDP and Population, 2023-2030 ($)
Figure 81: Belgium GDP – Composition of 2023, By Sector of Origin
Figure 82: Belgium Export and Import Value & Volume, 2023-2030 ($)
Figure 83: Spain GLV Display Technology Market Value & Volume, 2023-2030 ($)
Figure 84: Spain GDP and Population, 2023-2030 ($)
Figure 85: Spain GDP – Composition of 2023, By Sector of Origin
Figure 86: Spain Export and Import Value & Volume, 2023-2030 ($)
Figure 87: Denmark GLV Display Technology Market Value & Volume, 2023-2030 ($)
Figure 88: Denmark GDP and Population, 2023-2030 ($)
Figure 89: Denmark GDP – Composition of 2023, By Sector of Origin
Figure 90: Denmark Export and Import Value & Volume, 2023-2030 ($)
Figure 91: APAC GLV Display Technology Market Value & Volume, 2023-2030 ($)
Figure 92: China GLV Display Technology Market Value & Volume, 2023-2030
Figure 93: China GDP and Population, 2023-2030 ($)
Figure 94: China GDP – Composition of 2023, By Sector of Origin
Figure 95: China Export and Import Value & Volume, 2023-2030 ($)GLV Display Technology Market China Export and Import Value & Volume, 2023-2030 ($)
Figure 96: Australia GLV Display Technology Market Value & Volume, 2023-2030 ($)
Figure 97: Australia GDP and Population, 2023-2030 ($)
Figure 98: Australia GDP – Composition of 2023, By Sector of Origin
Figure 99: Australia Export and Import Value & Volume, 2023-2030 ($)
Figure 100: South Korea GLV Display Technology Market Value & Volume, 2023-2030 ($)
Figure 101: South Korea GDP and Population, 2023-2030 ($)
Figure 102: South Korea GDP – Composition of 2023, By Sector of Origin
Figure 103: South Korea Export and Import Value & Volume, 2023-2030 ($)
Figure 104: India GLV Display Technology Market Value & Volume, 2023-2030 ($)
Figure 105: India GDP and Population, 2023-2030 ($)
Figure 106: India GDP – Composition of 2023, By Sector of Origin
Figure 107: India Export and Import Value & Volume, 2023-2030 ($)
Figure 108: Taiwan GLV Display Technology Market Value & Volume, 2023-2030 ($)
Figure 109: Taiwan GDP and Population, 2023-2030 ($)
Figure 110: Taiwan GDP – Composition of 2023, By Sector of Origin
Figure 111: Taiwan Export and Import Value & Volume, 2023-2030 ($)
Figure 112: Malaysia GLV Display Technology Market Value & Volume, 2023-2030 ($)
Figure 113: Malaysia GDP and Population, 2023-2030 ($)
Figure 114: Malaysia GDP – Composition of 2023, By Sector of Origin
Figure 115: Malaysia Export and Import Value & Volume, 2023-2030 ($)
Figure 116: Hong Kong GLV Display Technology Market Value & Volume, 2023-2030 ($)
Figure 117: Hong Kong GDP and Population, 2023-2030 ($)
Figure 118: Hong Kong GDP – Composition of 2023, By Sector of Origin
Figure 119: Hong Kong Export and Import Value & Volume, 2023-2030 ($)
Figure 120: Middle East & Africa GLV Display Technology Market Middle East & Africa 3D Printing Market Value & Volume, 2023-2030 ($)
Figure 121: Russia GLV Display Technology Market Value & Volume, 2023-2030 ($)
Figure 122: Russia GDP and Population, 2023-2030 ($)
Figure 123: Russia GDP – Composition of 2023, By Sector of Origin
Figure 124: Russia Export and Import Value & Volume, 2023-2030 ($)
Figure 125: Israel GLV Display Technology Market Value & Volume, 2023-2030 ($)
Figure 126: Israel GDP and Population, 2023-2030 ($)
Figure 127: Israel GDP – Composition of 2023, By Sector of Origin
Figure 128: Israel Export and Import Value & Volume, 2023-2030 ($)
Figure 129: Entropy Share, By Strategies, 2023-2030* (%)GLV Display Technology Market
Figure 130: Developments, 2023-2030*GLV Display Technology Market
Figure 131: Company 1 GLV Display Technology Market Net Revenue, By Years, 2023-2030* ($)
Figure 132: Company 1 GLV Display Technology Market Net Revenue Share, By Business segments, 2023 (%)
Figure 133: Company 1 GLV Display Technology Market Net Sales Share, By Geography, 2023 (%)
Figure 134: Company 2 GLV Display Technology Market Net Revenue, By Years, 2023-2030* ($)
Figure 135: Company 2 GLV Display Technology Market Net Revenue Share, By Business segments, 2023 (%)
Figure 136: Company 2 GLV Display Technology Market Net Sales Share, By Geography, 2023 (%)
Figure 137: Company 3GLV Display Technology Market Net Revenue, By Years, 2023-2030* ($)
Figure 138: Company 3GLV Display Technology Market Net Revenue Share, By Business segments, 2023 (%)
Figure 139: Company 3GLV Display Technology Market Net Sales Share, By Geography, 2023 (%)
Figure 140: Company 4 GLV Display Technology Market Net Revenue, By Years, 2023-2030* ($)
Figure 141: Company 4 GLV Display Technology Market Net Revenue Share, By Business segments, 2023 (%)
Figure 142: Company 4 GLV Display Technology Market Net Sales Share, By Geography, 2023 (%)
Figure 143: Company 5 GLV Display Technology Market Net Revenue, By Years, 2023-2030* ($)
Figure 144: Company 5 GLV Display Technology Market Net Revenue Share, By Business segments, 2023 (%)
Figure 145: Company 5 GLV Display Technology Market Net Sales Share, By Geography, 2023 (%)
Figure 146: Company 6 GLV Display Technology Market Net Revenue, By Years, 2023-2030* ($)
Figure 147: Company 6 GLV Display Technology Market Net Revenue Share, By Business segments, 2023 (%)
Figure 148: Company 6 GLV Display Technology Market Net Sales Share, By Geography, 2023 (%)
Figure 149: Company 7 GLV Display Technology Market Net Revenue, By Years, 2023-2030* ($)
Figure 150: Company 7 GLV Display Technology Market Net Revenue Share, By Business segments, 2023 (%)
Figure 151: Company 7 GLV Display Technology Market Net Sales Share, By Geography, 2023 (%)
Figure 152: Company 8 GLV Display Technology Market Net Revenue, By Years, 2023-2030* ($)
Figure 153: Company 8 GLV Display Technology Market Net Revenue Share, By Business segments, 2023 (%)
Figure 154: Company 8 GLV Display Technology Market Net Sales Share, By Geography, 2023 (%)
Figure 155: Company 9 GLV Display Technology Market Net Revenue, By Years, 2023-2030* ($)
Figure 156: Company 9 GLV Display Technology Market Net Revenue Share, By Business segments, 2023 (%)
Figure 157: Company 9 GLV Display Technology Market Net Sales Share, By Geography, 2023 (%)
Figure 158: Company 10 GLV Display Technology Market Net Revenue, By Years, 2023-2030* ($)
Figure 159: Company 10 GLV Display Technology Market Net Revenue Share, By Business segments, 2023 (%)
Figure 160: Company 10 GLV Display Technology Market Net Sales Share, By Geography, 2023 (%)
Figure 161: Company 11 GLV Display Technology Market Net Revenue, By Years, 2023-2030* ($)
Figure 162: Company 11 GLV Display Technology Market Net Revenue Share, By Business segments, 2023 (%)
Figure 163: Company 11 GLV Display Technology Market Net Sales Share, By Geography, 2023 (%)
Figure 164: Company 12 GLV Display Technology Market Net Revenue, By Years, 2023-2030* ($)
Figure 165: Company 12 GLV Display Technology Market Net Revenue Share, By Business segments, 2023 (%)
Figure 166: Company 12 GLV Display Technology Market Net Sales Share, By Geography, 2023 (%)
Figure 167: Company 13GLV Display Technology Market Net Revenue, By Years, 2023-2030* ($)
Figure 168: Company 13GLV Display Technology Market Net Revenue Share, By Business segments, 2023 (%)
Figure 169: Company 13GLV Display Technology Market Net Sales Share, By Geography, 2023 (%)
Figure 170: Company 14 GLV Display Technology Market Net Revenue, By Years, 2023-2030* ($)
Figure 171: Company 14 GLV Display Technology Market Net Revenue Share, By Business segments, 2023 (%)
Figure 172: Company 14 GLV Display Technology Market Net Sales Share, By Geography, 2023 (%)
Figure 173: Company 15 GLV Display Technology Market Net Revenue, By Years, 2023-2030* ($)
Figure 174: Company 15 GLV Display Technology Market Net Revenue Share, By Business segments, 2023 (%)
Figure 175: Company 15 GLV Display Technology Market Net Sales Share, By Geography, 2023 (%)