 Email
Email Print
Print


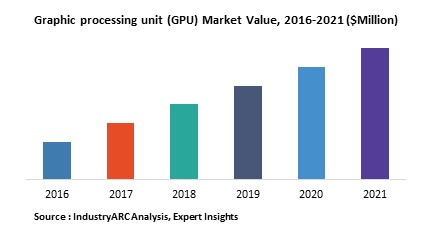
Graphic processing unit (GPU) Market - Forecast(2025 - 2031)
Graphic processing unit (GPU) Market Size is forecast to reach $ 4,35,760 Million by 2030, at a CAGR of 31.59% during forecast period 2024-2030.GPUs in association with CPUs are used to increase the overall processing power of a system for engineering, media and enterprise applications. GPUs can also be used for accelerating a number of applications ranging from graphics to even developing complex three-Dimensional (3D) models. One way that a GPU is able to improve the performance of a system for the various applications mentioned above is the ability of the GPU to have a number of cores which are able to process and undertake multiple task simultaneously whereas in a simple CPU, this takes place sequentially and hence, a number of complex functions would not operate effectively without the aid of a GPU.
The use of GPUs has been increasing considerably over the past decade primarily due to the entertainment and gaming industries. Both industries have been relying heavily on GPUs to develop more advanced computer graphic models as well as more complex and advanced games. Furthermore, many of these games are now played online involving multiple players to take part in these games. As such, the processing power required to run the games will be extremely high and is made possible only through the use of GPUs. The market is dominated primarily by one vendor that has had a controlling share for quite some time with another two companies behind the leader. GPUs are made available as a standard product offering on many computing devices primarily because of the number of processes and applications that are being used on a computing system nowadays. Initially, gaming would have been the only requirement for GPUs, however, with a number of processes now taking place online as well as with a vast volume of data and processing being stored online, GPUs have become even more essential.
- Smartphones
- Tablets
- Notebooks
- Workstations
- Gaming PC
- Computer aided design
- Flight Simulation
- Dedicated graphic cards
- Integrated graphics solutions
- Hybrid cards
- North America
- South America
- APAC
- Europe
- Middle East
- Africa
- Advanced Micro Devices , Inc.
- Intel Corporation
- Broadcom Corporation
- Qualcomm, Inc.
- Nvidia Corporation
Key Market Players:
The Top 5 companies in the Graphic processing unit (GPU) Market are:
- Intel Corporation
- Advanced Micro Devices, Inc.
- Samsung Electronics Co. Ltd.
- Nvidia Corporation
- Qualcomm Technologies, Inc.
For more Electronics Market reports, please click here
1. Graphic processing unit – Market Overview
2. Executive Summary
3. Graphic processing unit – Market Landscape
3.1. Market Share Analysis
3.2. Comparative Analysis
3.2.1. Product Benchmarking
3.2.2. End User Profiling
3.2.3. Top 5 Financials Analysis
4. Graphic processing unit – Market Forces
4.1. Market Drivers
4.2. Market Constraints
4.3. Market Challenges
4.4. Attractiveness of the Graphic processing unit (GPU) market
4.4.1. Power of Suppliers
4.4.2. Power of Customers
4.4.3. Threat of New Entrants
4.4.4. Threat of Substitution
4.4.5. Degree of Competition
5. Graphic processing unit (GPU) market – Strategic Analysis
5.1. Value Chain Analysis
5.2. Pricing Analysis
5.3. Opportunities Analysis
5.4. Product/Market Life Cycle Analysis
5.5. Suppliers and Distributors
6. Graphic processing unit (GPU) market– By Product
6.1. Smartphones
6.2. Tablets
6.3. Notebooks
6.4. Workstations
6.5. Gaming PC
7. Graphic processing unit (GPU) Market– By Application
7.1. Computer aided design
7.2. Flight Simulation
8. Graphic processing unit (GPU) Market– By Type
8.1. Dedicated graphic cards
8.2. Integrated graphics solutions
8.3. Hybrid cards
9. Graphic processing unit (GPU) Market– By Geography
9.1. Introduction
9.2. Global Study
9.3. Americas
9.3.1. North America
9.3.2. Brazil
9.3.3. Argentina
9.3.4. Others
9.4. Europe
9.4.1. U.K.
9.4.2. France
9.4.3. Germany
9.4.4. Others
9.5. APAC
9.5.1. China
9.5.2. Japan
9.5.3. India
9.5.4. Others
9.6. ROW
10. Graphic processing unit (GPU) Market Entropy
10.1. New Product Launches
10.2. M&As, Collaborations, JVs and Partnerships
11. Company Profiles
"*Financials would be provided on a best efforts basis for private companies"
12. Appendix
12.1. Abbreviations
12.2. Sources
12.3. Research Methodology
12.4. Bibliography
12.5. Compilation of Expert Insights
12.6. Disclaimer
List of Tables
Table 1: Graphic processing unit (GPU) Market Overview 2023-2030
Table 2: Graphic processing unit (GPU) Market Leader Analysis 2023-2030 (US$)
Table 3: Graphic processing unit (GPU) Market Product Analysis 2023-2030 (US$)
Table 4: Graphic processing unit (GPU) Market End User Analysis 2023-2030 (US$)
Table 5: Graphic processing unit (GPU) Market Patent Analysis 2013-2023* (US$)
Table 6: Graphic processing unit (GPU) Market Financial Analysis 2023-2030 (US$)
Table 7: Graphic processing unit (GPU) Market Driver Analysis 2023-2030 (US$)
Table 8: Graphic processing unit (GPU) Market Challenges Analysis 2023-2030 (US$)
Table 9: Graphic processing unit (GPU) Market Constraint Analysis 2023-2030 (US$)
Table 10: Graphic processing unit (GPU) Market Supplier Bargaining Power Analysis 2023-2030 (US$)
Table 11: Graphic processing unit (GPU) Market Buyer Bargaining Power Analysis 2023-2030 (US$)
Table 12: Graphic processing unit (GPU) Market Threat of Substitutes Analysis 2023-2030 (US$)
Table 13: Graphic processing unit (GPU) Market Threat of New Entrants Analysis 2023-2030 (US$)
Table 14: Graphic processing unit (GPU) Market Degree of Competition Analysis 2023-2030 (US$)
Table 15: Graphic processing unit (GPU) Market Value Chain Analysis 2023-2030 (US$)
Table 16: Graphic processing unit (GPU) Market Pricing Analysis 2023-2030 (US$)
Table 17: Graphic processing unit (GPU) Market Opportunities Analysis 2023-2030 (US$)
Table 18: Graphic processing unit (GPU) Market Product Life Cycle Analysis 2023-2030 (US$)
Table 19: Graphic processing unit (GPU) Market Supplier Analysis 2023-2030 (US$)
Table 20: Graphic processing unit (GPU) Market Distributor Analysis 2023-2030 (US$)
Table 21: Graphic processing unit (GPU) Market Trend Analysis 2023-2030 (US$)
Table 22: Graphic processing unit (GPU) Market Size 2023 (US$)
Table 23: Graphic processing unit (GPU) Market Forecast Analysis 2023-2030 (US$)
Table 24: Graphic processing unit (GPU) Market Sales Forecast Analysis 2023-2030 (Units)
Table 25: Graphic processing unit (GPU) Market, Revenue & Volume, By Type, 2023-2030 ($)
Table 26: Graphic processing unit (GPU) Market By Type, Revenue & Volume, By Dedicated graphic cards, 2023-2030 ($)
Table 27: Graphic processing unit (GPU) Market By Type, Revenue & Volume, By Integrated graphics solutions, 2023-2030 ($)
Table 28: Graphic processing unit (GPU) Market By Type, Revenue & Volume, By Hybrid cards, 2023-2030 ($)
Table 29: Graphic processing unit (GPU) Market, Revenue & Volume, By Product, 2023-2030 ($)
Table 30: Graphic processing unit (GPU) Market By Product, Revenue & Volume, By Smartphones, 2023-2030 ($)
Table 31: Graphic processing unit (GPU) Market By Product, Revenue & Volume, By Tablets, 2023-2030 ($)
Table 32: Graphic processing unit (GPU) Market By Product, Revenue & Volume, By Notebooks, 2023-2030 ($)
Table 33: Graphic processing unit (GPU) Market By Product, Revenue & Volume, By Workstations, 2023-2030 ($)
Table 34: Graphic processing unit (GPU) Market By Product, Revenue & Volume, By Gaming PC, 2023-2030 ($)
Table 35: Graphic processing unit (GPU) Market, Revenue & Volume, By Application, 2023-2030 ($)
Table 36: Graphic processing unit (GPU) Market By Application, Revenue & Volume, By Computer aided design, 2023-2030 ($)
Table 37: Graphic processing unit (GPU) Market By Application, Revenue & Volume, By Flight Simulation, 2023-2030 ($)
Table 38: North America Graphic processing unit (GPU) Market, Revenue & Volume, By Type, 2023-2030 ($)
Table 39: North America Graphic processing unit (GPU) Market, Revenue & Volume, By Product, 2023-2030 ($)
Table 40: North America Graphic processing unit (GPU) Market, Revenue & Volume, By Application, 2023-2030 ($)
Table 41: South america Graphic processing unit (GPU) Market, Revenue & Volume, By Type, 2023-2030 ($)
Table 42: South america Graphic processing unit (GPU) Market, Revenue & Volume, By Product, 2023-2030 ($)
Table 43: South america Graphic processing unit (GPU) Market, Revenue & Volume, By Application, 2023-2030 ($)
Table 44: Europe Graphic processing unit (GPU) Market, Revenue & Volume, By Type, 2023-2030 ($)
Table 45: Europe Graphic processing unit (GPU) Market, Revenue & Volume, By Product, 2023-2030 ($)
Table 46: Europe Graphic processing unit (GPU) Market, Revenue & Volume, By Application, 2023-2030 ($)
Table 47: APAC Graphic processing unit (GPU) Market, Revenue & Volume, By Type, 2023-2030 ($)
Table 48: APAC Graphic processing unit (GPU) Market, Revenue & Volume, By Product, 2023-2030 ($)
Table 49: APAC Graphic processing unit (GPU) Market, Revenue & Volume, By Application, 2023-2030 ($)
Table 50: Middle East & Africa Graphic processing unit (GPU) Market, Revenue & Volume, By Type, 2023-2030 ($)
Table 51: Middle East & Africa Graphic processing unit (GPU) Market, Revenue & Volume, By Product, 2023-2030 ($)
Table 52: Middle East & Africa Graphic processing unit (GPU) Market, Revenue & Volume, By Application, 2023-2030 ($)
Table 53: Russia Graphic processing unit (GPU) Market, Revenue & Volume, By Type, 2023-2030 ($)
Table 54: Russia Graphic processing unit (GPU) Market, Revenue & Volume, By Product, 2023-2030 ($)
Table 55: Russia Graphic processing unit (GPU) Market, Revenue & Volume, By Application, 2023-2030 ($)
Table 56: Israel Graphic processing unit (GPU) Market, Revenue & Volume, By Type, 2023-2030 ($)
Table 57: Israel Graphic processing unit (GPU) Market, Revenue & Volume, By Product, 2023-2030 ($)
Table 58: Israel Graphic processing unit (GPU) Market, Revenue & Volume, By Application, 2023-2030 ($)
Table 59: Top Companies 2023 (US$)Graphic processing unit (GPU) Market, Revenue & Volume
Table 60: Product Launch 2023-2030Graphic processing unit (GPU) Market, Revenue & Volume
Table 61: Mergers & Acquistions 2023-2030Graphic processing unit (GPU) Market, Revenue & Volume
List of Figures
Figure 1: Overview of Graphic processing unit (GPU) Market 2023-2030
Figure 2: Market Share Analysis for Graphic processing unit (GPU) Market 2023 (US$)
Figure 3: Product Comparison in Graphic processing unit (GPU) Market 2023-2030 (US$)
Figure 4: End User Profile for Graphic processing unit (GPU) Market 2023-2030 (US$)
Figure 5: Patent Application and Grant in Graphic processing unit (GPU) Market 2013-2023* (US$)
Figure 6: Top 5 Companies Financial Analysis in Graphic processing unit (GPU) Market 2023-2030 (US$)
Figure 7: Market Entry Strategy in Graphic processing unit (GPU) Market 2023-2030
Figure 8: Ecosystem Analysis in Graphic processing unit (GPU) Market 2023
Figure 9: Average Selling Price in Graphic processing unit (GPU) Market 2023-2030
Figure 10: Top Opportunites in Graphic processing unit (GPU) Market 2023-2030
Figure 11: Market Life Cycle Analysis in Graphic processing unit (GPU) Market
Figure 12: GlobalBy TypeGraphic processing unit (GPU) Market Revenue, 2023-2030 ($)
Figure 13: GlobalBy ProductGraphic processing unit (GPU) Market Revenue, 2023-2030 ($)
Figure 14: GlobalBy ApplicationGraphic processing unit (GPU) Market Revenue, 2023-2030 ($)
Figure 15: Global Graphic processing unit (GPU) Market - By Geography
Figure 16: Global Graphic processing unit (GPU) Market Value & Volume, By Geography, 2023-2030 ($)
Figure 17: Global Graphic processing unit (GPU) Market CAGR, By Geography, 2023-2030 (%)
Figure 18: North America Graphic processing unit (GPU) Market Value & Volume, 2023-2030 ($)
Figure 19: US Graphic processing unit (GPU) Market Value & Volume, 2023-2030 ($)
Figure 20: US GDP and Population, 2023-2030 ($)
Figure 21: US GDP – Composition of 2023, By Sector of Origin
Figure 22: US Export and Import Value & Volume, 2023-2030 ($)
Figure 23: Canada Graphic processing unit (GPU) Market Value & Volume, 2023-2030 ($)
Figure 24: Canada GDP and Population, 2023-2030 ($)
Figure 25: Canada GDP – Composition of 2023, By Sector of Origin
Figure 26: Canada Export and Import Value & Volume, 2023-2030 ($)
Figure 27: Mexico Graphic processing unit (GPU) Market Value & Volume, 2023-2030 ($)
Figure 28: Mexico GDP and Population, 2023-2030 ($)
Figure 29: Mexico GDP – Composition of 2023, By Sector of Origin
Figure 30: Mexico Export and Import Value & Volume, 2023-2030 ($)
Figure 31: South America Graphic processing unit (GPU) Market Value & Volume, 2023-2030 ($)
Figure 32: Brazil Graphic processing unit (GPU) Market Value & Volume, 2023-2030 ($)
Figure 33: Brazil GDP and Population, 2023-2030 ($)
Figure 34: Brazil GDP – Composition of 2023, By Sector of Origin
Figure 35: Brazil Export and Import Value & Volume, 2023-2030 ($)
Figure 36: Venezuela Graphic processing unit (GPU) Market Value & Volume, 2023-2030 ($)
Figure 37: Venezuela GDP and Population, 2023-2030 ($)
Figure 38: Venezuela GDP – Composition of 2023, By Sector of Origin
Figure 39: Venezuela Export and Import Value & Volume, 2023-2030 ($)
Figure 40: Argentina Graphic processing unit (GPU) Market Value & Volume, 2023-2030 ($)
Figure 41: Argentina GDP and Population, 2023-2030 ($)
Figure 42: Argentina GDP – Composition of 2023, By Sector of Origin
Figure 43: Argentina Export and Import Value & Volume, 2023-2030 ($)
Figure 44: Ecuador Graphic processing unit (GPU) Market Value & Volume, 2023-2030 ($)
Figure 45: Ecuador GDP and Population, 2023-2030 ($)
Figure 46: Ecuador GDP – Composition of 2023, By Sector of Origin
Figure 47: Ecuador Export and Import Value & Volume, 2023-2030 ($)
Figure 48: Peru Graphic processing unit (GPU) Market Value & Volume, 2023-2030 ($)
Figure 49: Peru GDP and Population, 2023-2030 ($)
Figure 50: Peru GDP – Composition of 2023, By Sector of Origin
Figure 51: Peru Export and Import Value & Volume, 2023-2030 ($)
Figure 52: Colombia Graphic processing unit (GPU) Market Value & Volume, 2023-2030 ($)
Figure 53: Colombia GDP and Population, 2023-2030 ($)
Figure 54: Colombia GDP – Composition of 2023, By Sector of Origin
Figure 55: Colombia Export and Import Value & Volume, 2023-2030 ($)
Figure 56: Costa Rica Graphic processing unit (GPU) Market Value & Volume, 2023-2030 ($)
Figure 57: Costa Rica GDP and Population, 2023-2030 ($)
Figure 58: Costa Rica GDP – Composition of 2023, By Sector of Origin
Figure 59: Costa Rica Export and Import Value & Volume, 2023-2030 ($)
Figure 60: Europe Graphic processing unit (GPU) Market Value & Volume, 2023-2030 ($)
Figure 61: U.K Graphic processing unit (GPU) Market Value & Volume, 2023-2030 ($)
Figure 62: U.K GDP and Population, 2023-2030 ($)
Figure 63: U.K GDP – Composition of 2023, By Sector of Origin
Figure 64: U.K Export and Import Value & Volume, 2023-2030 ($)
Figure 65: Germany Graphic processing unit (GPU) Market Value & Volume, 2023-2030 ($)
Figure 66: Germany GDP and Population, 2023-2030 ($)
Figure 67: Germany GDP – Composition of 2023, By Sector of Origin
Figure 68: Germany Export and Import Value & Volume, 2023-2030 ($)
Figure 69: Italy Graphic processing unit (GPU) Market Value & Volume, 2023-2030 ($)
Figure 70: Italy GDP and Population, 2023-2030 ($)
Figure 71: Italy GDP – Composition of 2023, By Sector of Origin
Figure 72: Italy Export and Import Value & Volume, 2023-2030 ($)
Figure 73: France Graphic processing unit (GPU) Market Value & Volume, 2023-2030 ($)
Figure 74: France GDP and Population, 2023-2030 ($)
Figure 75: France GDP – Composition of 2023, By Sector of Origin
Figure 76: France Export and Import Value & Volume, 2023-2030 ($)
Figure 77: Netherlands Graphic processing unit (GPU) Market Value & Volume, 2023-2030 ($)
Figure 78: Netherlands GDP and Population, 2023-2030 ($)
Figure 79: Netherlands GDP – Composition of 2023, By Sector of Origin
Figure 80: Netherlands Export and Import Value & Volume, 2023-2030 ($)
Figure 81: Belgium Graphic processing unit (GPU) Market Value & Volume, 2023-2030 ($)
Figure 82: Belgium GDP and Population, 2023-2030 ($)
Figure 83: Belgium GDP – Composition of 2023, By Sector of Origin
Figure 84: Belgium Export and Import Value & Volume, 2023-2030 ($)
Figure 85: Spain Graphic processing unit (GPU) Market Value & Volume, 2023-2030 ($)
Figure 86: Spain GDP and Population, 2023-2030 ($)
Figure 87: Spain GDP – Composition of 2023, By Sector of Origin
Figure 88: Spain Export and Import Value & Volume, 2023-2030 ($)
Figure 89: Denmark Graphic processing unit (GPU) Market Value & Volume, 2023-2030 ($)
Figure 90: Denmark GDP and Population, 2023-2030 ($)
Figure 91: Denmark GDP – Composition of 2023, By Sector of Origin
Figure 92: Denmark Export and Import Value & Volume, 2023-2030 ($)
Figure 93: APAC Graphic processing unit (GPU) Market Value & Volume, 2023-2030 ($)
Figure 94: China Graphic processing unit (GPU) Market Value & Volume, 2023-2030
Figure 95: China GDP and Population, 2023-2030 ($)
Figure 96: China GDP – Composition of 2023, By Sector of Origin
Figure 97: China Export and Import Value & Volume, 2023-2030 ($)Graphic processing unit (GPU) Market China Export and Import Value & Volume, 2023-2030 ($)
Figure 98: Australia Graphic processing unit (GPU) Market Value & Volume, 2023-2030 ($)
Figure 99: Australia GDP and Population, 2023-2030 ($)
Figure 100: Australia GDP – Composition of 2023, By Sector of Origin
Figure 101: Australia Export and Import Value & Volume, 2023-2030 ($)
Figure 102: South Korea Graphic processing unit (GPU) Market Value & Volume, 2023-2030 ($)
Figure 103: South Korea GDP and Population, 2023-2030 ($)
Figure 104: South Korea GDP – Composition of 2023, By Sector of Origin
Figure 105: South Korea Export and Import Value & Volume, 2023-2030 ($)
Figure 106: India Graphic processing unit (GPU) Market Value & Volume, 2023-2030 ($)
Figure 107: India GDP and Population, 2023-2030 ($)
Figure 108: India GDP – Composition of 2023, By Sector of Origin
Figure 109: India Export and Import Value & Volume, 2023-2030 ($)
Figure 110: Taiwan Graphic processing unit (GPU) Market Value & Volume, 2023-2030 ($)
Figure 111: Taiwan GDP and Population, 2023-2030 ($)
Figure 112: Taiwan GDP – Composition of 2023, By Sector of Origin
Figure 113: Taiwan Export and Import Value & Volume, 2023-2030 ($)
Figure 114: Malaysia Graphic processing unit (GPU) Market Value & Volume, 2023-2030 ($)
Figure 115: Malaysia GDP and Population, 2023-2030 ($)
Figure 116: Malaysia GDP – Composition of 2023, By Sector of Origin
Figure 117: Malaysia Export and Import Value & Volume, 2023-2030 ($)
Figure 118: Hong Kong Graphic processing unit (GPU) Market Value & Volume, 2023-2030 ($)
Figure 119: Hong Kong GDP and Population, 2023-2030 ($)
Figure 120: Hong Kong GDP – Composition of 2023, By Sector of Origin
Figure 121: Hong Kong Export and Import Value & Volume, 2023-2030 ($)
Figure 122: Middle East & Africa Graphic processing unit (GPU) Market Middle East & Africa 3D Printing Market Value & Volume, 2023-2030 ($)
Figure 123: Russia Graphic processing unit (GPU) Market Value & Volume, 2023-2030 ($)
Figure 124: Russia GDP and Population, 2023-2030 ($)
Figure 125: Russia GDP – Composition of 2023, By Sector of Origin
Figure 126: Russia Export and Import Value & Volume, 2023-2030 ($)
Figure 127: Israel Graphic processing unit (GPU) Market Value & Volume, 2023-2030 ($)
Figure 128: Israel GDP and Population, 2023-2030 ($)
Figure 129: Israel GDP – Composition of 2023, By Sector of Origin
Figure 130: Israel Export and Import Value & Volume, 2023-2030 ($)
Figure 131: Entropy Share, By Strategies, 2023-2030* (%)Graphic processing unit (GPU) Market
Figure 132: Developments, 2023-2030*Graphic processing unit (GPU) Market
Figure 133: Company 1 Graphic processing unit (GPU) Market Net Revenue, By Years, 2023-2030* ($)
Figure 134: Company 1 Graphic processing unit (GPU) Market Net Revenue Share, By Business segments, 2023 (%)
Figure 135: Company 1 Graphic processing unit (GPU) Market Net Sales Share, By Geography, 2023 (%)
Figure 136: Company 2 Graphic processing unit (GPU) Market Net Revenue, By Years, 2023-2030* ($)
Figure 137: Company 2 Graphic processing unit (GPU) Market Net Revenue Share, By Business segments, 2023 (%)
Figure 138: Company 2 Graphic processing unit (GPU) Market Net Sales Share, By Geography, 2023 (%)
Figure 139: Company 3 Graphic processing unit (GPU) Market Net Revenue, By Years, 2023-2030* ($)
Figure 140: Company 3 Graphic processing unit (GPU) Market Net Revenue Share, By Business segments, 2023 (%)
Figure 141: Company 3 Graphic processing unit (GPU) Market Net Sales Share, By Geography, 2023 (%)
Figure 142: Company 4 Graphic processing unit (GPU) Market Net Revenue, By Years, 2023-2030* ($)
Figure 143: Company 4 Graphic processing unit (GPU) Market Net Revenue Share, By Business segments, 2023 (%)
Figure 144: Company 4 Graphic processing unit (GPU) Market Net Sales Share, By Geography, 2023 (%)
Figure 145: Company 5 Graphic processing unit (GPU) Market Net Revenue, By Years, 2023-2030* ($)
Figure 146: Company 5 Graphic processing unit (GPU) Market Net Revenue Share, By Business segments, 2023 (%)
Figure 147: Company 5 Graphic processing unit (GPU) Market Net Sales Share, By Geography, 2023 (%)
Figure 148: Company 6 Graphic processing unit (GPU) Market Net Revenue, By Years, 2023-2030* ($)
Figure 149: Company 6 Graphic processing unit (GPU) Market Net Revenue Share, By Business segments, 2023 (%)
Figure 150: Company 6 Graphic processing unit (GPU) Market Net Sales Share, By Geography, 2023 (%)
Figure 151: Company 7 Graphic processing unit (GPU) Market Net Revenue, By Years, 2023-2030* ($)
Figure 152: Company 7 Graphic processing unit (GPU) Market Net Revenue Share, By Business segments, 2023 (%)
Figure 153: Company 7 Graphic processing unit (GPU) Market Net Sales Share, By Geography, 2023 (%)
Figure 154: Company 8 Graphic processing unit (GPU) Market Net Revenue, By Years, 2023-2030* ($)
Figure 155: Company 8 Graphic processing unit (GPU) Market Net Revenue Share, By Business segments, 2023 (%)
Figure 156: Company 8 Graphic processing unit (GPU) Market Net Sales Share, By Geography, 2023 (%)
Figure 157: Company 9 Graphic processing unit (GPU) Market Net Revenue, By Years, 2023-2030* ($)
Figure 158: Company 9 Graphic processing unit (GPU) Market Net Revenue Share, By Business segments, 2023 (%)
Figure 159: Company 9 Graphic processing unit (GPU) Market Net Sales Share, By Geography, 2023 (%)
Figure 160: Company 10 Graphic processing unit (GPU) Market Net Revenue, By Years, 2023-2030* ($)
Figure 161: Company 10 Graphic processing unit (GPU) Market Net Revenue Share, By Business segments, 2023 (%)
Figure 162: Company 10 Graphic processing unit (GPU) Market Net Sales Share, By Geography, 2023 (%)
Figure 163: Company 11 Graphic processing unit (GPU) Market Net Revenue, By Years, 2023-2030* ($)
Figure 164: Company 11 Graphic processing unit (GPU) Market Net Revenue Share, By Business segments, 2023 (%)
Figure 165: Company 11 Graphic processing unit (GPU) Market Net Sales Share, By Geography, 2023 (%)
Figure 166: Company 12 Graphic processing unit (GPU) Market Net Revenue, By Years, 2023-2030* ($)
Figure 167: Company 12 Graphic processing unit (GPU) Market Net Revenue Share, By Business segments, 2023 (%)
Figure 168: Company 12 Graphic processing unit (GPU) Market Net Sales Share, By Geography, 2023 (%)
Figure 169: Company 13 Graphic processing unit (GPU) Market Net Revenue, By Years, 2023-2030* ($)
Figure 170: Company 13 Graphic processing unit (GPU) Market Net Revenue Share, By Business segments, 2023 (%)
Figure 171: Company 13 Graphic processing unit (GPU) Market Net Sales Share, By Geography, 2023 (%)
Figure 172: Company 14 Graphic processing unit (GPU) Market Net Revenue, By Years, 2023-2030* ($)
Figure 173: Company 14 Graphic processing unit (GPU) Market Net Revenue Share, By Business segments, 2023 (%)
Figure 174: Company 14 Graphic processing unit (GPU) Market Net Sales Share, By Geography, 2023 (%)
Figure 175: Company 15 Graphic processing unit (GPU) Market Net Revenue, By Years, 2023-2030* ($)
Figure 176: Company 15 Graphic processing unit (GPU) Market Net Revenue Share, By Business segments, 2023 (%)
Figure 177: Company 15 Graphic processing unit (GPU) Market Net Sales Share, By Geography, 2023 (%)