 Email
Email Print
Print


Cyber Security Market Overview:
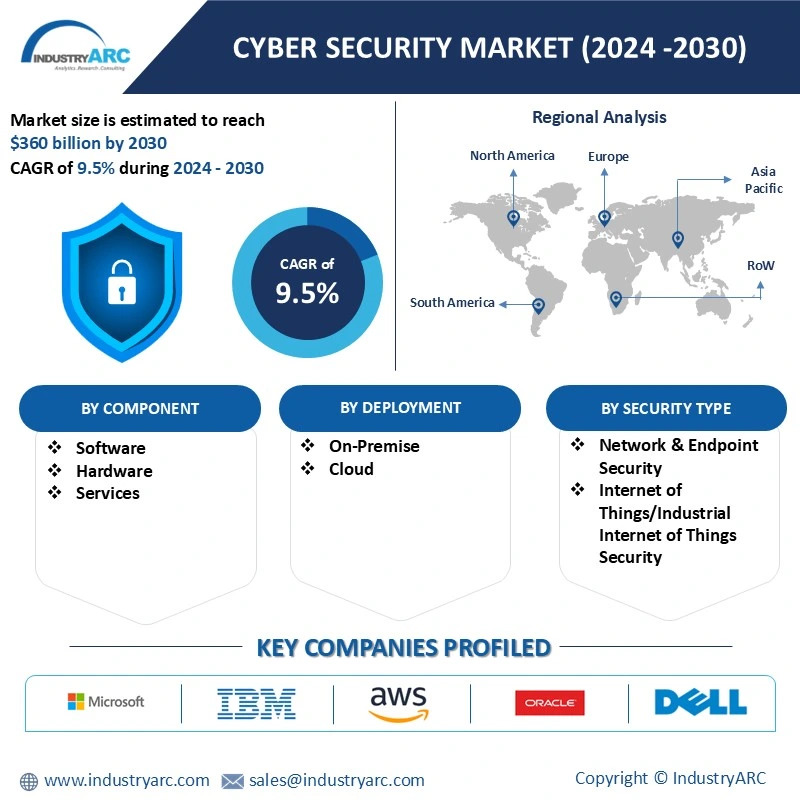
The Cyber Security Market size is estimated to reach $360 Billion by 2030, growing at a CAGR of 9.5% during the forecast period 2024-2030. The market is projected to grow significantly in the coming years, propelled by increased digital transformation, adoption of cloud computing, and expansion of IoT ecosystems. Key segments within the market include network security, endpoint security, application security, cloud security, and identity management. The demand for advanced technologies such as artificial intelligence (AI), machine learning (ML), and blockchain to enhance threat detection and response is reshaping the industry landscape.
Industries such as banking, financial services, and insurance (BFSI), healthcare, and retail are the largest adopters, prioritizing investments in cybersecurity to safeguard sensitive data. However, challenges like the shortage of skilled professionals and evolving threat landscapes persist. To counteract these, companies are focusing on strategic collaborations, acquisitions, and R&D to innovate scalable, cost-effective solutions, ensuring robust market expansion and resilience.
Market Snapshot:
Cyber Security Market - Report Coverage:
The “Cyber Security Market Report - Forecast (2024-2030)” by IndustryARC, covers an in-depth analysis of the following segments in the Cyber Security Market.
|
|
|
|
|
|
|
|
|
|
|
|
|
|
|
|
|
|
|
|
COVID-19 / Ukraine Crisis - Impact Analysis:
• The COVID-19 pandemic significantly boosted the Cybersecurity Market, driven by the accelerated adoption of remote work, cloud services, and digital platforms. This surge increased exposure to cyber threats, prompting heightened investments in security solutions. Industries prioritized endpoint security, VPNs, and identity management, while cybercriminals exploited vulnerabilities, intensifying demand for advanced threat detection and response technologies, reshaping the market's growth trajectory.
• The Ukrainian crisis has significantly heightened demand in the cybersecurity market as organizations globally face increased risks of cyberattacks and geopolitical tensions. Governments and enterprises are investing in advanced threat detection, endpoint security, and network resilience solutions to mitigate potential breaches. This geopolitical instability underscores the urgent need for robust cybersecurity measures, driving market growth and innovation.
Key Takeaways:
Asia-Pacific Region is Projected as Fastest Growing Region
Asia-Pacific is projected as the fastest growing region in Cyber Security Market with CAGR of 10.8% during the forecast period 2024-2030. The growth is driven by rapid digitalization, increasing internet penetration, and a surge in cyber threats across industries. Key economies such as China, India, Japan, and South Korea are investing heavily in advanced cybersecurity solutions to safeguard critical infrastructure, financial systems, and sensitive data. With the proliferation of cloud computing, IoT devices, and 5G networks, APAC has become a prime target for sophisticated cyberattacks, including ransomware, phishing, and state-sponsored activities. Governments and organizations in the region are implementing stringent cybersecurity policies and expanding their IT budgets to address these challenges. Initiatives such as India's "Digital India" and China's focus on digital transformation have further accelerated the adoption of cybersecurity measures. The growing presence of multinational technology companies and local cybersecurity providers is fostering innovation in the market. Additionally, increasing regulatory compliance requirements, such as data protection laws, are compelling businesses to adopt robust security frameworks. As a result, the APAC cybersecurity market is poised for sustained growth, contributing significantly to the global cybersecurity landscape.
Telecommunications Segment to Register the Fastest Growth
Telecommunications segment is projected as the fastest growing segment in Cyber Security Market with CAGR of 10.2% during the forecast period 2024-2030. This growth is driven by the increasing reliance on digital communication networks, the rapid adoption of 5G technology, and the surge in cyber threats targeting telecommunications infrastructure. As critical enablers of connectivity, telecom companies face unique vulnerabilities, including DDoS attacks, ransomware, and data breaches, making cybersecurity a top priority. The expansion of IoT, cloud computing, and edge technologies further amplifies the complexity and scale of securing telecom networks.
Telecom providers are investing heavily in advanced threat detection systems, endpoint security, and encryption solutions to safeguard their operations. Additionally, regulatory mandates and rising customer expectations for secure communications are accelerating the adoption of cybersecurity measures. This dynamic landscape positions the telecommunications segment as a crucial driver of innovation and resilience in the global cybersecurity market.
Cloud are Leading the Market
Cloud held the largest market share of 53.1% in the Cybersecurity market in 2023. This leadership is attributed to the accelerated adoption of cloud computing across industries, driven by digital transformation and the demand for scalable, cost-effective solutions. As businesses increasingly migrate critical operations and data to the cloud, the need for robust security measures has become paramount. The cloud’s widespread use in remote work, e-commerce, and data storage has made it a prime target for cyber threats such as data breaches, ransomware, and advanced persistent threats (APTs). In response, organizations are prioritizing investments in cloud-specific security solutions, including access controls, data encryption, and real-time threat monitoring. Additionally, compliance with stringent data protection regulations and growing awareness of cybersecurity risks have further fueled demand for cloud-based security services. This trend underscores the cloud’s pivotal role in shaping the future of cybersecurity, driving innovation and market growth.
Rising Cyber Threat Landscape
The increasing sophistication and frequency of cyber threats are major drivers of the cybersecurity market. Organizations across industries face evolving challenges such as ransomware, phishing, advanced persistent threats (APTs), and zero-day vulnerabilities. Cybercriminals are leveraging AI and machine learning to develop more potent and targeted attacks, putting sensitive data, financial systems, and critical infrastructure at risk. This rising threat landscape has compelled businesses to invest in proactive measures, such as threat intelligence, endpoint security, and incident response systems. Governments are also prioritizing national security by implementing stricter regulations and initiatives to combat cybercrime. For instance, mandates like the General Data Protection Regulation (GDPR) and the Cybersecurity Maturity Model Certification (CMMC) enforce compliance, further driving demand for robust security solutions. As the digital ecosystem grows, cyber threats become more pervasive, making advanced cybersecurity essential for organizations aiming to safeguard their operations and maintain stakeholder trust.
Rapid Adoption of Cloud Computing and IoT
The growing adoption of cloud computing and Internet of Things (IoT) technologies is a key driver for the cybersecurity market. Businesses are increasingly transitioning to cloud-based environments for their scalability, cost-efficiency, and enhanced collaboration capabilities. Simultaneously, IoT devices are proliferating in smart homes, healthcare, manufacturing, and connected vehicles, expanding the attack surface for potential cyber intrusions. These technologies, while transformative, introduce unique vulnerabilities such as insecure interfaces, lack of encryption, and susceptibility to botnet attacks. As a result, the demand for specialized cybersecurity solutions tailored to cloud and IoT environments has surged. Organizations are investing in cloud access security brokers (CASBs), endpoint security, and device management systems to mitigate risks. Furthermore, the integration of 5G networks has accelerated IoT adoption, intensifying the need for robust security frameworks. This shift underscores the critical role cybersecurity plays in enabling the secure and sustainable growth of cloud and IoT ecosystems.
Key Market Players:
Product/Service launches, approvals, patents and events, acquisitions, partnerships, and collaborations are key strategies adopted by players in the Cyber Security Market. The top 10 companies in this industry are listed below:
1. Dell
2. IBM
3. Amazon Web Services
4. Oracle Co
5. Microsoft
6. Cisco systems
7. McAfee
8. Palo Alto Networks, Inc.
9. Fortinet
10. Check Point Software Technologies
Scope of the Report:
|
|
|
|
|
|
|
|
|
|
|
|
|
|
|
|
|
|
|
|
|
|
|
|
1.1. Definitions and Scope
2. Cyber Security Market - Executive Summary
3. Cyber Security Market - Comparative Analysis
3.1. Company Benchmarking - Key Companies
3.2. Financial Analysis - Key Companies
3.3. Market Share Analysis - Key Companies
3.4. Patent Analysis - Major Companies
3.5. Pricing Analysis (ASPs will be provided)
4. Cyber Security Market - Start-up Companies Scenario
4.1. Key Start-up Company Analysis:
4.1.1. Investment
4.1.2. Revenue
4.1.3. Product portfolio
4.1.4. Venture Capital and Funding Scenario
5. Cyber Security Market – Industry Market Entry Scenario Premium
5.1. Regulatory Framework Overview
5.2. New Business and Ease of Doing Business Index
5.3. Successful Venture Profiles
5.4. Customer Analysis – Major companies
5.5. Customer Landscape Analysis
5.5.1. Adoption Rate
5.5.2. Purchasing Criteria
6. Cyber Security Market - Forces
6.1. Market Drivers
6.2. Market Constraints
6.3. Porter's Five Force Model
6.3.1. Bargaining Power of Suppliers
6.3.2. Bargaining Powers of Customers
6.3.3. Threat of New Entrants
6.3.4. Rivalry Among Existing Players
6.3.5. Threat of Substitutes
7. Cyber Security Market – Strategic Analysis
7.1. Value Chain Analysis
7.2. Opportunities Analysis
7.3. Product Life Cycle/Market Life Cycle
7.4. Distributor Analysis – Major Companies
8. Cyber Security Market – By Component (Market Size – $Million/$Billion)
8.1. Software
8.2. Hardware
8.3. Services
8.3.1. Managed Security Services
8.3.2. Professional Services
9. Cyber Security Market– By Deployment (Market Size – $Million/$Billion)
9.1. On-Premise
9.2. Cloud
10. Cyber Security Market– By Security Type (Market Size – $Million/$Billion)
10.1. Network & Endpoint Security
10.2. Internet of Things/Industrial Internet of Things Security
10.3. Threat Intelligence
10.4. Mobile Security
10.5. Behavioral Detection
10.6. Cloud Security
10.7. Deception Security
10.8. Others
11. Cyber Security Market– By Organization Size (Market Size – $Million/$Billion)
11.1. SME
11.2. Large Enterprise
12. Cyber Security Market– By Solution (Market Size – $Million/$Billion)
12.1. Antivirus
12.2. Unified Threat Management (UTM)
12.3. Security Information and Event Management (SIEM)
12.4. Distributed Denial-of-Service (DDOS) Mitigation
12.5. Disaster Recovery
12.6. Firewall
12.7. Data Loss Prevention (DLP)
12.8. Web Filtering
12.9. Threat Intelligence
12.10 .IAM
12.11 .Risk and Compliance Management
12.12 .IDS
12.13 .Encryption
12.14 .Others
13. Cyber Security Market– By Industry Vertical (Market Size – $Million/$Billion)
13.1. Information Technology & Telecommunications
13.2. BFSI
13.3. Manufacturing
13.4. Retail
13.5. Energy and Utilities
13.6. Government and Defense
13.7. Automotive
13.8. Healthcare
13.9. Education
13.10 .Media & Entertainment
13.11 .Transportation and Logistics
13.12 .Others
14. Cyber Security Market – by Geography (Market Size – $Million/$Billion)
14.1. North America
14.1.1. U.S
14.1.2. Canada
14.1.3. Mexico
14.2. Europe
14.2.1. Germany
14.2.2. France
14.2.3. UK
14.2.4. Italy
14.2.5. Spain
14.2.6. Russia
14.2.7. Netherlands
14.2.8. Rest of Europe
14.3. Asia-Pacific
14.3.1. China
14.3.2. Japan
14.3.3. South Korea
14.3.4. India
14.3.5. Australia
14.3.6. Indonesia
14.3.7. Malaysia
14.3.8. Rest of Asia-Pacific
14.4. South America
14.4.1. Brazil
14.4.2. Argentina
14.4.3. Chile
14.4.4. Colombia
14.4.5. Rest of South America
14.5. Rest of The World
14.5.1. Middle East
14.5.2. Africa
15. Cyber Security Market – Entropy
15.1. New product launches
15.2. M&A's, collaborations, JVs and partnerships
16. Cyber Security Market – Industry/Segment Competition Landscape
16.1. Market Share at Global Level - Major companies
16.2. Market Share by Key Region - Major companies
16.3. Market Share by Key Country - Major companies
17. Cyber Security Market – Key Company List by Country Premium
18. Cyber Security Market – Company Analysis
18.1. Dell
18.2. IBM
18.3. Amazon Web Services
18.4. Oracle Co
18.5. Microsoft
18.6. Cisco systems
18.7. McAfee
18.8. Palo Alto Networks, Inc.
18.9. Fortinet
18.10 .Check Point Software Technologies
The Cyber Security Market is projected to grow at 9.5% CAGR during the forecast period 2024-2030.
The Cyber Security Market size is estimated to be $360 Billion in 2023 and is projected to reach $ 679.52 Billion by 2030
The leading players in the Cyber Security Market are Dell, IBM, Amazon Web Services, Oracle Co, Microsoft and Others