 Email
Email Print
Print


Inclusion Body Myositis Market - By Structural Feature & By Test Type - Forecast(2024 - 2030)
Inclusion Body Myositis Market Overview
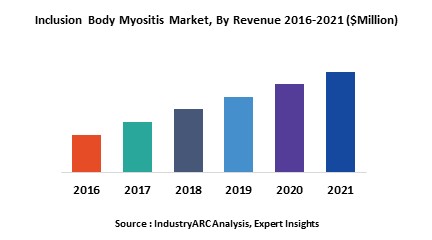
Inclusion Body Myositis Market Size is forecast to reach $ 11540 Million by 2030, at a CAGR of 5.30% during forecast period 2024-2030. Inclusion body myositis or IBM as it is commonly referred to, is a muscle disorder, which presents itself with age. As IBM is a disorder and not a disease, there is no cure as such and is inevitable for aged individuals. The onset of this disorder affects an individual’s normal motor functions as it attacks the individual’s muscles, tendons and ligaments. As the disorder strikes an individual at the internal level, it can often be missed. There have been numerous cases of the disorder being misdiagnosed, which often leads to complications in the long term. The disorder normally presents itself in individuals over the age of 60, however, there have been situations where the disorder has been affecting individuals as young as 40. This has been noticed over the last decade and can be attributed to the lifestyle being in play these days. Sedentary lifestyles, no proper sleep pattern, improper diet and so on often lead to muscle fatigue which eventually is a precursor for IBM in the long run and hence, affects younger individuals as well.
There is no specific test which can identify IBM in an individual, however, a combination of tests such as Full blood count, Calcium and Phosphate, Creatine Kinase, Erythrocyte Sedimentation Rate and so on will be a good indicator of whether the disorder has set in or not. There are however a number of therapies which have helped in slowing down IBM. This however is something, which is not found to be true across the board for all individuals, and results tend to vary. As such, clinical trials are still ongoing by numerous companies, but nothing has been confirmed as of yet.
In terms of which regions are affected the most by this, North America and Europe are affected the most as on date. A number of reasons could be responsible for this, some of which include the lifestyle being led as well as the climatic conditions where the cold could aid the early onset of this disorder. It is also for this reason that there is a high demand for numerous therapies in these regions for IBM.
The Inclusion body myositis Market can be segmented as
- on the basis of structural feature
- Cytoplasmic Vacuolation, Inflammatory Infiltrate and Tubo-Filamentous
- In terms of test type
- Full blood count, Calcium and Phosphate, Creatine Kinase, Erythrocyte Sedimentation Rate, and Fasting Glucose, Nerve conduction, Electromyography, Muscle Biopsy and Electron Microscopy
- By Geography
- North America, South America, APAC, Europe, Middle East and Africa
Key Market Players:
The Top 5 companies in the Inclusion Body Myositis Market are:
- Novartis AG
- NobelPharma Co. Ltd.
- Pfizer Inc.
- Gradalis Inc.
- Abcuro Inc.
1. Inclusion body myositis– Market Overview
2. Executive Summary
3. Inclusion body myositis– Market Landscape
3.1. Market Share Analysis
3.2. Comparative Analysis
3.2.1. Product Benchmarking
3.2.2. End User Profiling
3.2.3. Top 5 Financials Analysis
4. Inclusion body myositis– Market Forces
4.1. Market Drivers
4.2. Market Constraints
4.3. Market Challenges
4.4. Attractiveness of the Inclusion body myositis Market
4.4.1. Power of Suppliers
4.4.2. Power of Customers
4.4.3. Threat of New Entrants
4.4.4. Threat of Substitution
4.4.5. Degree of Competition
5. Inclusion body myositis Market– Strategic Analysis
5.1. Value Chain Analysis
5.2. Pricing Analysis
5.3. Opportunities Analysis
5.4. Product/Market Life Cycle Analysis
5.5. Suppliers and Distributors
6. Inclusion body myositis Market– By Structural Feature:
6.1. Cytoplasmic Vacuolation
6.2. Inflammatory Infiltrate
6.3. Tubo-Filamentous
7. Inclusion body myositis Market– By Test Type:
7.1. Full blood count
7.2. Calcium and Phosphate
7.3. Creatine Kinase
7.4. Erythrocyte Sedimentation Rate
7.5. Fasting Glucose
7.6. Nerve conduction
7.7. Electromyography
7.8. Muscle Biopsy
7.9. Electron Microscopy
8. Inclusion body myositis Market– By Geography:
8.1. Introduction
8.2. Global Study
8.3. Americas
8.3.1. North America
8.3.2. Brazil
8.3.3. Argentina
8.3.4. Others
8.4. Europe
8.4.1. U.K.
8.4.2. France
8.4.3. Germany
8.4.4. Others
8.5. APAC
8.5.1. China
8.5.2. Japan
8.5.3. India
8.5.4. Others
8.6. ROW
9. Inclusion body myositis Market Entropy
9.1. New Product Launches
9.2. M&As, Collaborations, JVs and Partnerships
10. Company Profiles
10.1. Gradalis, Inc.
10.2. New Zealand Pharmaceuticals Ltd.
10.3. Nobelpharma Co
10.4. Novartis AG
*More than 40 Companies are profiled in this Research Report, Complete List available on Request*
"*Financials would be provided on a best efforts basis for private companies"
11. Appendix
11.1. Abbreviations
11.2. Sources
11.3. Research Methodology
11.4. Bibliography
11.5. Compilation of Expert Insights
11.6. Disclaimer
List of Tables:
Table 1: Inclusion Body Myositis Market Overview 2023-2030
Table 2: Inclusion Body Myositis Market Leader Analysis 2023-2030 (US$)
Table 3: Inclusion Body Myositis Market Product Analysis 2023-2030 (US$)
Table 4: Inclusion Body Myositis Market End User Analysis 2023-2030 (US$)
Table 5: Inclusion Body Myositis Market Patent Analysis 2013-2023* (US$)
Table 6: Inclusion Body Myositis Market Financial Analysis 2023-2030 (US$)
Table 7: Inclusion Body Myositis Market Driver Analysis 2023-2030 (US$)
Table 8: Inclusion Body Myositis Market Challenges Analysis 2023-2030 (US$)
Table 9: Inclusion Body Myositis Market Constraint Analysis 2023-2030 (US$)
Table 10: Inclusion Body Myositis Market Supplier Bargaining Power Analysis 2023-2030 (US$)
Table 11: Inclusion Body Myositis Market Buyer Bargaining Power Analysis 2023-2030 (US$)
Table 12: Inclusion Body Myositis Market Threat of Substitutes Analysis 2023-2030 (US$)
Table 13: Inclusion Body Myositis Market Threat of New Entrants Analysis 2023-2030 (US$)
Table 14: Inclusion Body Myositis Market Degree of Competition Analysis 2023-2030 (US$)
Table 15: Inclusion Body Myositis Market Value Chain Analysis 2023-2030 (US$)
Table 16: Inclusion Body Myositis Market Pricing Analysis 2023-2030 (US$)
Table 17: Inclusion Body Myositis Market Opportunities Analysis 2023-2030 (US$)
Table 18: Inclusion Body Myositis Market Product Life Cycle Analysis 2023-2030 (US$)
Table 19: Inclusion Body Myositis Market Supplier Analysis 2023-2030 (US$)
Table 20: Inclusion Body Myositis Market Distributor Analysis 2023-2030 (US$)
Table 21: Inclusion Body Myositis Market Trend Analysis 2023-2030 (US$)
Table 22: Inclusion Body Myositis Market Size 2023 (US$)
Table 23: Inclusion Body Myositis Market Forecast Analysis 2023-2030 (US$)
Table 24: Inclusion Body Myositis Market Sales Forecast Analysis 2023-2030 (Units)
Table 25: Inclusion Body Myositis Market, Revenue & Volume, By Type, 2023-2030 ($)
Table 26: Inclusion Body Myositis Market By Type, Revenue & Volume, By Full blood count, 2023-2030 ($)
Table 27: Inclusion Body Myositis Market By Type, Revenue & Volume, By Calcium and Phosphate, 2023-2030 ($)
Table 28: Inclusion Body Myositis Market By Type, Revenue & Volume, By Creatine Kinase, 2023-2030 ($)
Table 29 " Inclusion Body Myositis Market By Type, Revenue & Volume, By Erythrocyte Sedimentation Rate, 2023-2030 ($)"
Table 30: Inclusion Body Myositis Market By Type, Revenue & Volume, By Fasting Glucose, 2023-2030 ($)
Table 31: North America Inclusion Body Myositis Market, Revenue & Volume, By Type, 2023-2030 ($)
Table 32: South america Inclusion Body Myositis Market, Revenue & Volume, By Type, 2023-2030 ($)
Table 33: Europe Inclusion Body Myositis Market, Revenue & Volume, By Type, 2023-2030 ($)
Table 34: APAC Inclusion Body Myositis Market, Revenue & Volume, By Type, 2023-2030 ($)
Table 35: Middle East & Africa Inclusion Body Myositis Market, Revenue & Volume, By Type, 2023-2030 ($)
Table 36: Russia Inclusion Body Myositis Market, Revenue & Volume, By Type, 2023-2030 ($)
Table 37: Israel Inclusion Body Myositis Market, Revenue & Volume, By Type, 2023-2030 ($)
Table 38: Top Companies 2023 (US$)Inclusion Body Myositis Market, Revenue & Volume
Table 39: Product Launch 2023-2030Inclusion Body Myositis Market, Revenue & Volume
Table 40: Mergers & Acquistions 2023-2030Inclusion Body Myositis Market, Revenue & Volume
List of Figures:
Figure 1: Overview of Inclusion Body Myositis Market 2023-2030
Figure 2: Market Share Analysis for Inclusion Body Myositis Market 2023 (US$)
Figure 3: Product Comparison in Inclusion Body Myositis Market 2023-2030 (US$)
Figure 4: End User Profile for Inclusion Body Myositis Market 2023-2030 (US$)
Figure 5: Patent Application and Grant in Inclusion Body Myositis Market 2013-2023* (US$)
Figure 6: Top 5 Companies Financial Analysis in Inclusion Body Myositis Market 2023-2030 (US$)
Figure 7: Market Entry Strategy in Inclusion Body Myositis Market 2023-2030
Figure 8: Ecosystem Analysis in Inclusion Body Myositis Market 2023
Figure 9: Average Selling Price in Inclusion Body Myositis Market 2023-2030
Figure 10: Top Opportunites in Inclusion Body Myositis Market 2023-2030
Figure 11: Market Life Cycle Analysis in Inclusion Body Myositis Market
Figure 12: GlobalBy TypeInclusion Body Myositis Market Revenue, 2023-2030 ($)
Figure 13: Global Inclusion Body Myositis Market - By Geography
Figure 14: Global Inclusion Body Myositis Market Value & Volume, By Geography, 2023-2030 ($)
Figure 15: Global Inclusion Body Myositis Market CAGR, By Geography, 2023-2030 (%)
Figure 16: North America Inclusion Body Myositis Market Value & Volume, 2023-2030 ($)
Figure 17: US Inclusion Body Myositis Market Value & Volume, 2023-2030 ($)
Figure 18: US GDP and Population, 2023-2030 ($)
Figure 19: US GDP – Composition of 2023, By Sector of Origin
Figure 20: US Export and Import Value & Volume, 2023-2030 ($)
Figure 21: Canada Inclusion Body Myositis Market Value & Volume, 2023-2030 ($)
Figure 22: Canada GDP and Population, 2023-2030 ($)
Figure 23: Canada GDP – Composition of 2023, By Sector of Origin
Figure 24: Canada Export and Import Value & Volume, 2023-2030 ($)
Figure 25: Mexico Inclusion Body Myositis Market Value & Volume, 2023-2030 ($)
Figure 26: Mexico GDP and Population, 2023-2030 ($)
Figure 27: Mexico GDP – Composition of 2023, By Sector of Origin
Figure 28: Mexico Export and Import Value & Volume, 2023-2030 ($)
Figure 29: South America Inclusion Body Myositis Market Value & Volume, 2023-2030 ($)
Figure 30: Brazil Inclusion Body Myositis Market Value & Volume, 2023-2030 ($)
Figure 31: Brazil GDP and Population, 2023-2030 ($)
Figure 32: Brazil GDP – Composition of 2023, By Sector of Origin
Figure 33: Brazil Export and Import Value & Volume, 2023-2030 ($)
Figure 34: Venezuela Inclusion Body Myositis Market Value & Volume, 2023-2030 ($)
Figure 35: Venezuela GDP and Population, 2023-2030 ($)
Figure 36: Venezuela GDP – Composition of 2023, By Sector of Origin
Figure 37: Venezuela Export and Import Value & Volume, 2023-2030 ($)
Figure 38: Argentina Inclusion Body Myositis Market Value & Volume, 2023-2030 ($)
Figure 39: Argentina GDP and Population, 2023-2030 ($)
Figure 40: Argentina GDP – Composition of 2023, By Sector of Origin
Figure 41: Argentina Export and Import Value & Volume, 2023-2030 ($)
Figure 42: Ecuador Inclusion Body Myositis Market Value & Volume, 2023-2030 ($)
Figure 43: Ecuador GDP and Population, 2023-2030 ($)
Figure 44: Ecuador GDP – Composition of 2023, By Sector of Origin
Figure 45: Ecuador Export and Import Value & Volume, 2023-2030 ($)
Figure 46: Peru Inclusion Body Myositis Market Value & Volume, 2023-2030 ($)
Figure 47: Peru GDP and Population, 2023-2030 ($)
Figure 48: Peru GDP – Composition of 2023, By Sector of Origin
Figure 49: Peru Export and Import Value & Volume, 2023-2030 ($)
Figure 50: Colombia Inclusion Body Myositis Market Value & Volume, 2023-2030 ($)
Figure 51: Colombia GDP and Population, 2023-2030 ($)
Figure 52: Colombia GDP – Composition of 2023, By Sector of Origin
Figure 53: Colombia Export and Import Value & Volume, 2023-2030 ($)
Figure 54: Costa Rica Inclusion Body Myositis Market Value & Volume, 2023-2030 ($)
Figure 55: Costa Rica GDP and Population, 2023-2030 ($)
Figure 56: Costa Rica GDP – Composition of 2023, By Sector of Origin
Figure 57: Costa Rica Export and Import Value & Volume, 2023-2030 ($)
Figure 58: Europe Inclusion Body Myositis Market Value & Volume, 2023-2030 ($)
Figure 59: U.K Inclusion Body Myositis Market Value & Volume, 2023-2030 ($)
Figure 60: U.K GDP and Population, 2023-2030 ($)
Figure 61: U.K GDP – Composition of 2023, By Sector of Origin
Figure 62: U.K Export and Import Value & Volume, 2023-2030 ($)
Figure 63: Germany Inclusion Body Myositis Market Value & Volume, 2023-2030 ($)
Figure 64: Germany GDP and Population, 2023-2030 ($)
Figure 65: Germany GDP – Composition of 2023, By Sector of Origin
Figure 66: Germany Export and Import Value & Volume, 2023-2030 ($)
Figure 67: Italy Inclusion Body Myositis Market Value & Volume, 2023-2030 ($)
Figure 68: Italy GDP and Population, 2023-2030 ($)
Figure 69: Italy GDP – Composition of 2023, By Sector of Origin
Figure 70: Italy Export and Import Value & Volume, 2023-2030 ($)
Figure 71: France Inclusion Body Myositis Market Value & Volume, 2023-2030 ($)
Figure 72: France GDP and Population, 2023-2030 ($)
Figure 73: France GDP – Composition of 2023, By Sector of Origin
Figure 74: France Export and Import Value & Volume, 2023-2030 ($)
Figure 75: Netherlands Inclusion Body Myositis Market Value & Volume, 2023-2030 ($)
Figure 76: Netherlands GDP and Population, 2023-2030 ($)
Figure 77: Netherlands GDP – Composition of 2023, By Sector of Origin
Figure 78: Netherlands Export and Import Value & Volume, 2023-2030 ($)
Figure 79: Belgium Inclusion Body Myositis Market Value & Volume, 2023-2030 ($)
Figure 80: Belgium GDP and Population, 2023-2030 ($)
Figure 81: Belgium GDP – Composition of 2023, By Sector of Origin
Figure 82: Belgium Export and Import Value & Volume, 2023-2030 ($)
Figure 83: Spain Inclusion Body Myositis Market Value & Volume, 2023-2030 ($)
Figure 84: Spain GDP and Population, 2023-2030 ($)
Figure 85: Spain GDP – Composition of 2023, By Sector of Origin
Figure 86: Spain Export and Import Value & Volume, 2023-2030 ($)
Figure 87: Denmark Inclusion Body Myositis Market Value & Volume, 2023-2030 ($)
Figure 88: Denmark GDP and Population, 2023-2030 ($)
Figure 89: Denmark GDP – Composition of 2023, By Sector of Origin
Figure 90: Denmark Export and Import Value & Volume, 2023-2030 ($)
Figure 91: APAC Inclusion Body Myositis Market Value & Volume, 2023-2030 ($)
Figure 92: China Inclusion Body Myositis Market Value & Volume, 2023-2030
Figure 93: China GDP and Population, 2023-2030 ($)
Figure 94: China GDP – Composition of 2023, By Sector of Origin
Figure 95: China Export and Import Value & Volume, 2023-2030 ($)Inclusion Body Myositis Market China Export and Import Value & Volume, 2023-2030 ($)
Figure 96: Australia Inclusion Body Myositis Market Value & Volume, 2023-2030 ($)
Figure 97: Australia GDP and Population, 2023-2030 ($)
Figure 98: Australia GDP – Composition of 2023, By Sector of Origin
Figure 99: Australia Export and Import Value & Volume, 2023-2030 ($)
Figure 100: South Korea Inclusion Body Myositis Market Value & Volume, 2023-2030 ($)
Figure 101: South Korea GDP and Population, 2023-2030 ($)
Figure 102: South Korea GDP – Composition of 2023, By Sector of Origin
Figure 103: South Korea Export and Import Value & Volume, 2023-2030 ($)
Figure 104: India Inclusion Body Myositis Market Value & Volume, 2023-2030 ($)
Figure 105: India GDP and Population, 2023-2030 ($)
Figure 106: India GDP – Composition of 2023, By Sector of Origin
Figure 107: India Export and Import Value & Volume, 2023-2030 ($)
Figure 108: Taiwan Inclusion Body Myositis Market Value & Volume, 2023-2030 ($)
Figure 109: Taiwan GDP and Population, 2023-2030 ($)
Figure 110: Taiwan GDP – Composition of 2023, By Sector of Origin
Figure 111: Taiwan Export and Import Value & Volume, 2023-2030 ($)
Figure 112: Malaysia Inclusion Body Myositis Market Value & Volume, 2023-2030 ($)
Figure 113: Malaysia GDP and Population, 2023-2030 ($)
Figure 114: Malaysia GDP – Composition of 2023, By Sector of Origin
Figure 115: Malaysia Export and Import Value & Volume, 2023-2030 ($)
Figure 116: Hong Kong Inclusion Body Myositis Market Value & Volume, 2023-2030 ($)
Figure 117: Hong Kong GDP and Population, 2023-2030 ($)
Figure 118: Hong Kong GDP – Composition of 2023, By Sector of Origin
Figure 119: Hong Kong Export and Import Value & Volume, 2023-2030 ($)
Figure 120: Middle East & Africa Inclusion Body Myositis Market Middle East & Africa 3D Printing Market Value & Volume, 2023-2030 ($)
Figure 121: Russia Inclusion Body Myositis Market Value & Volume, 2023-2030 ($)
Figure 122: Russia GDP and Population, 2023-2030 ($)
Figure 123: Russia GDP – Composition of 2023, By Sector of Origin
Figure 124: Russia Export and Import Value & Volume, 2023-2030 ($)
Figure 125: Israel Inclusion Body Myositis Market Value & Volume, 2023-2030 ($)
Figure 126: Israel GDP and Population, 2023-2030 ($)
Figure 127: Israel GDP – Composition of 2023, By Sector of Origin
Figure 128: Israel Export and Import Value & Volume, 2023-2030 ($)
Figure 129: Entropy Share, By Strategies, 2023-2030* (%)Inclusion Body Myositis Market
Figure 130: Developments, 2023-2030*Inclusion Body Myositis Market
Figure 131: Company 1 Inclusion Body Myositis Market Net Revenue, By Years, 2023-2030* ($)
Figure 132: Company 1 Inclusion Body Myositis Market Net Revenue Share, By Business segments, 2023 (%)
Figure 133: Company 1 Inclusion Body Myositis Market Net Sales Share, By Geography, 2023 (%)
Figure 134: Company 2 Inclusion Body Myositis Market Net Revenue, By Years, 2023-2030* ($)
Figure 135: Company 2 Inclusion Body Myositis Market Net Revenue Share, By Business segments, 2023 (%)
Figure 136: Company 2 Inclusion Body Myositis Market Net Sales Share, By Geography, 2023 (%)
Figure 137: Company 3 Inclusion Body Myositis Market Net Revenue, By Years, 2023-2030* ($)
Figure 138: Company 3 Inclusion Body Myositis Market Net Revenue Share, By Business segments, 2023 (%)
Figure 139: Company 3 Inclusion Body Myositis Market Net Sales Share, By Geography, 2023 (%)
Figure 140: Company 4 Inclusion Body Myositis Market Net Revenue, By Years, 2023-2030* ($)
Figure 141: Company 4 Inclusion Body Myositis Market Net Revenue Share, By Business segments, 2023 (%)
Figure 142: Company 4 Inclusion Body Myositis Market Net Sales Share, By Geography, 2023 (%)
Figure 143: Company 5 Inclusion Body Myositis Market Net Revenue, By Years, 2023-2030* ($)
Figure 144: Company 5 Inclusion Body Myositis Market Net Revenue Share, By Business segments, 2023 (%)
Figure 145: Company 5 Inclusion Body Myositis Market Net Sales Share, By Geography, 2023 (%)
Figure 146: Company 6 Inclusion Body Myositis Market Net Revenue, By Years, 2023-2030* ($)
Figure 147: Company 6 Inclusion Body Myositis Market Net Revenue Share, By Business segments, 2023 (%)
Figure 148: Company 6 Inclusion Body Myositis Market Net Sales Share, By Geography, 2023 (%)
Figure 149: Company 7 Inclusion Body Myositis Market Net Revenue, By Years, 2023-2030* ($)
Figure 150: Company 7 Inclusion Body Myositis Market Net Revenue Share, By Business segments, 2023 (%)
Figure 151: Company 7 Inclusion Body Myositis Market Net Sales Share, By Geography, 2023 (%)
Figure 152: Company 8 Inclusion Body Myositis Market Net Revenue, By Years, 2023-2030* ($)
Figure 153: Company 8 Inclusion Body Myositis Market Net Revenue Share, By Business segments, 2023 (%)
Figure 154: Company 8 Inclusion Body Myositis Market Net Sales Share, By Geography, 2023 (%)
Figure 155: Company 9 Inclusion Body Myositis Market Net Revenue, By Years, 2023-2030* ($)
Figure 156: Company 9 Inclusion Body Myositis Market Net Revenue Share, By Business segments, 2023 (%)
Figure 157: Company 9 Inclusion Body Myositis Market Net Sales Share, By Geography, 2023 (%)
Figure 158: Company 10 Inclusion Body Myositis Market Net Revenue, By Years, 2023-2030* ($)
Figure 159: Company 10 Inclusion Body Myositis Market Net Revenue Share, By Business segments, 2023 (%)
Figure 160: Company 10 Inclusion Body Myositis Market Net Sales Share, By Geography, 2023 (%)
Figure 161: Company 11 Inclusion Body Myositis Market Net Revenue, By Years, 2023-2030* ($)
Figure 162: Company 11 Inclusion Body Myositis Market Net Revenue Share, By Business segments, 2023 (%)
Figure 163: Company 11 Inclusion Body Myositis Market Net Sales Share, By Geography, 2023 (%)
Figure 164: Company 12 Inclusion Body Myositis Market Net Revenue, By Years, 2023-2030* ($)
Figure 165: Company 12 Inclusion Body Myositis Market Net Revenue Share, By Business segments, 2023 (%)
Figure 166: Company 12 Inclusion Body Myositis Market Net Sales Share, By Geography, 2023 (%)
Figure 167: Company 13 Inclusion Body Myositis Market Net Revenue, By Years, 2023-2030* ($)
Figure 168: Company 13 Inclusion Body Myositis Market Net Revenue Share, By Business segments, 2023 (%)
Figure 169: Company 13 Inclusion Body Myositis Market Net Sales Share, By Geography, 2023 (%)
Figure 170: Company 14 Inclusion Body Myositis Market Net Revenue, By Years, 2023-2030* ($)
Figure 171: Company 14 Inclusion Body Myositis Market Net Revenue Share, By Business segments, 2023 (%)
Figure 172: Company 14 Inclusion Body Myositis Market Net Sales Share, By Geography, 2023 (%)
Figure 173: Company 15 Inclusion Body Myositis Market Net Revenue, By Years, 2023-2030* ($)
Figure 174: Company 15 Inclusion Body Myositis Market Net Revenue Share, By Business segments, 2023 (%)
Figure 175: Company 15 Inclusion Body Myositis Market Net Sales Share, By Geography, 2023 (%)