 Email
Email Print
Print


Telehealth Services Market- By Category; By End-User; By Delivery Mode & By Region (North America, Europe, Others) - Forecast (2024-2030)
Overview
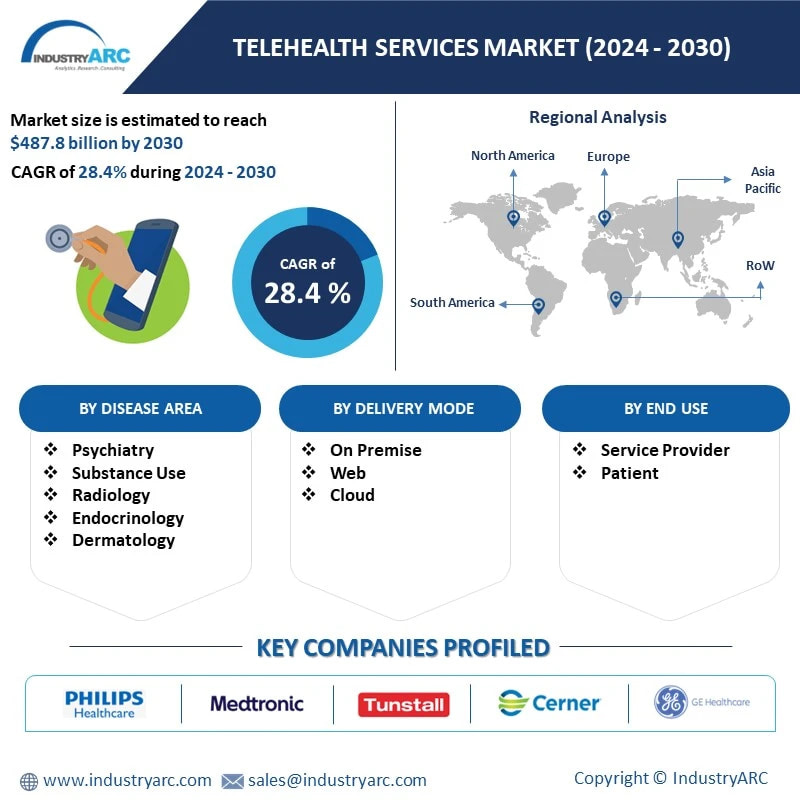
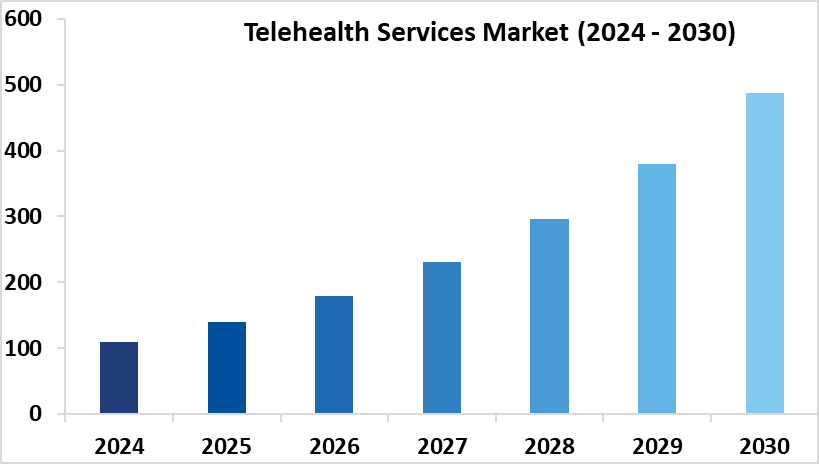
The Telehealth Services Market size is forecast to reach USD 487.8 billion by 2030, after growing at a CAGR of 28.4% during the forecast period 2024-2030. Integration of Electronic Health Records (EHR) with telecare platforms is streamlining patient data management and enhancing remote consultations. Healthcare providers are leveraging this trend to improve care coordination and patient outcomes. Mobile health applications and wearable devices are becoming integral components of telehealth services. The proliferation of smartphones and wearables enables patients to monitor their health remotely and facilitates real-time communication with healthcare professionals. Healthcare providers are increasingly adopting a digital-first approach, prioritizing virtual consultations and remote monitoring for non-emergency medical needs. This trend reflects the growing acceptance and effectiveness of telehealth services among both patients and providers. The rollout of 5G technology is poised to revolutionize telehealth services by enabling high-speed data transfer and reducing latency. Enhanced connectivity will support advanced telemedicine applications such as remote surgeries and real-time diagnostics. Integration of Artificial Intelligence (AI) algorithms into telehealth platforms is enhancing diagnostic accuracy, personalizing patient care, and optimizing resource allocation. AI-driven telehealth solutions are expected to improve efficiency and effectiveness in healthcare delivery.
The demand for Telehealth Services is escalating due to several key factors driving its growth. Patient demand for convenient access to healthcare services is a primary catalyst, emphasizing the need for accessible and timely medical care. Technological advancements, including improved telecom infrastructure and rising smartphone usage, are facilitating easier access to telehealth solutions. Additionally, the COVID-19 pandemic has accelerated the adoption of telehealth, highlighting its efficacy and safety during times of crisis.
Market Snapshot:
Report Coverage
The report “Telehealth Services Market – Forecast (2024-2030)”, by IndustryARC, covers an in-depth analysis of the following segments of the Telehealth Services Market.
By Category: Software, Hardware.
By Delivery Mode: On Premise, Web and Cloud.
By End Use: Service Provider and Patient.
By Disease Area: Psychiatry, Substance Use, Radiology, Endocrinology, Dermatology, Gastroenterology, Neurological Medicine, ENT, Cardiology, Oncology, Dental, Gynecology, General Medicine, and Others
By Geography: North America (U.S, Canada, Mexico), Europe (Germany, UK, France, Italy, Spain, Russia, Netherlands and Others), APAC (China, Japan India, South Korea, Australia & New Zealand, Indonesia, Malaysia, Taiwan and Others), South America (Brazil, Argentina, Chile, Colombia and others), and RoW (Middle East and Africa).
Key Takeaways
- North America held the largest market share with 49% in 2023. North America boasts advanced technological infrastructure and widespread internet access, facilitating the adoption of telehealth services. Innovations such as remote monitoring devices, telemedicine platforms, and mobile health applications enhance accessibility and convenience for patients.
- The growing demand for remote healthcare services, especially in rural and underserved areas, has propelled the adoption of telehealth solutions. Patients seek timely medical advice and treatment options without the need for physical appointments, contributing to the popularity of telehealth services.
- Rapid advancements in technology, especially in communication and digital healthcare platforms, have facilitated the expansion of telehealth services. Innovations such as secure video conferencing, remote monitoring devices, and mobile health applications have made it easier for healthcare providers to connect with patients virtually.
By Delivery Mode - Segment Analysis
Web dominated the Telehealth Services Market in 2023. Web-based telehealth platforms offer patients convenient access to healthcare services from the comfort of their homes. This accessibility eliminates barriers related to transportation and physical mobility, making healthcare more inclusive and readily available to a broader population. Web-based telehealth solutions enable healthcare providers to extend their services beyond geographical boundaries, reaching remote and underserved areas. This scalability enhances the reach of healthcare services, ensuring patients in rural or distant locations can receive timely medical attention. Advances in web technologies, including secure video conferencing, real-time data exchange, and remote monitoring capabilities, enhance the functionality and effectiveness of telehealth platforms. These technological innovations improve the quality of care delivered through web-based telehealth services. Web-based telehealth consultations often result in lower healthcare costs compared to traditional in-person visits. Reduced travel expenses and overhead costs contribute to the overall affordability of telehealth services, making healthcare more financially accessible for patients.
By End Use - Segment Analysis
Patient dominated the Telehealth Services Market in 2023. Patients seek convenience in accessing healthcare services, especially those living in remote areas or with mobility constraints. Telehealth offers a solution by providing virtual consultations and remote monitoring, eliminating the need for physical visits to healthcare facilities. The focus on patient-centered care drives the adoption of telehealth. Patients value the flexibility to schedule appointments according to their convenience and appreciate the reduced waiting times associated with virtual consultations. Moreover, telehealth platforms often provide secure communication channels, fostering better patient-provider relationships. Telehealth services offer cost-saving benefits for patients, reducing expenses associated with transportation, parking fees, and childcare. Patients are inclined towards telehealth options that provide quality care at a lower cost, making it an attractive alternative to traditional healthcare settings. Telehealth enables patients to actively participate in their healthcare journey through remote monitoring of vital signs, medication management, and lifestyle interventions. Patients appreciate the opportunity to take charge of their health with real-time feedback and personalized interventions facilitated by telehealth technologies.
By Geography - Segment Analysis
North America dominated the Telehealth Services Market in 2023. The North America Telehealth Services Market is projected to experience significant growth during the forecast period. North America's robust technological infrastructure fosters innovation in telehealth services. Advancements in telecommunications, data analytics, and remote monitoring technologies enhance the efficiency and effectiveness of telehealth platforms, improving patient outcomes and healthcare delivery. According to the Centers for Medicare & Medicaid Services, Health care spending in the United States increased by 4.1% in 2022 to reach $4.5 trillion, exceeding the 3.2% increase in 2021. Rising healthcare costs in North America drive the adoption of telehealth services as a cost-effective alternative to traditional in-person consultations. Telehealth offers convenient and affordable options for patients to access healthcare professionals without the need for extensive travel or long wait times, thereby reducing overall healthcare expenditures. The aging population in North America demands accessible and convenient healthcare solutions. Telehealth services cater to the needs of elderly individuals by providing remote consultations, monitoring chronic conditions, and delivering personalized care plans, addressing the healthcare requirements of aging demographics while ensuring comfort and convenience.
For more details on this report - Request for Sample
Drivers – Telehealth Services Market
-
Increased demand for remote healthcare solutions.
Technological advancements have facilitated the development of sophisticated telehealth platforms, enabling seamless communication between healthcare providers and patients regardless of geographical barriers. These platforms offer convenient access to medical consultations, monitoring, and diagnostic services, enhancing patient engagement and satisfaction. Furthermore, demographic shifts, including aging populations and increasing prevalence of chronic diseases, have fueled the demand for telehealth services. Remote monitoring and telemedicine enable proactive management of chronic conditions, improving patient outcomes and reducing healthcare costs in the long run. Moreover, regulatory changes and policy initiatives have played a pivotal role in expanding telehealth services, fostering reimbursement mechanisms and addressing legal barriers. These regulatory reforms have encouraged healthcare providers to integrate telehealth into their practice models, driving widespread adoption and acceptance among both patients and practitioners.
-
Growing need for virtual consultations.
Virtual consultations offer patients the convenience of accessing healthcare services from the comfort of their homes, eliminating the need for travel and reducing waiting times at healthcare facilities. With the advancements in technology, virtual consultations enable remote patient monitoring, allowing healthcare providers to track patients' health conditions continuously. This proactive approach to healthcare management enhances patient outcomes and reduces hospital readmissions. Virtual consultations bridge geographical barriers, particularly in rural and underserved areas where access to healthcare services is limited. Patients residing in remote locations can connect with healthcare professionals seamlessly, improving healthcare accessibility and equity. Continuous innovations in telehealth technology, including video conferencing platforms, mobile apps, and wearable devices, enhance the quality and scope of virtual consultations, making them more interactive, secure, and user-friendly.
Challenges – Telehealth Services Market
Privacy and Security Concerns
With sensitive medical data being transmitted and stored digitally, ensuring robust protection against breaches and unauthorized access is paramount. Maintaining compliance with stringent privacy regulations like HIPAA adds complexity to service provision. Implementing encryption protocols, secure data storage practices, and authentication measures are essential for building trust among patients and healthcare providers. Addressing these challenges requires ongoing investment in cybersecurity infrastructure and proactive risk management strategies to safeguard patient confidentiality and uphold the integrity of telehealth services.
Market Landscape
Technology launches, acquisitions, and R&D activities are key strategies adopted by players in the Telehealth Services Market. in 2023, The major players in the Telehealth Services Market are Philips Healthcare, Medtronic, Inc., Tunstall Healthcare, Cerner Corporation, Cisco Systems, Inc., GE Healthcare, Mckesson Corporation, Siemens Healthcare, Teladoc Health Inc., American Well and Others.
Developments:
- In July 2022, MediBuddy, a health tech startup, has acquired Clinix, a telehealth platform specializing in rural India's online health services.
For more Lifesciences and Healthcare related reports, please click here
List of Tables
Table 1: Telehealth Services Market Overview 2023-2030
Table 2: Telehealth Services Market Leader Analysis 2023-2030 (US$)
Table 3: Telehealth Services Market Product Analysis 2023-2030 (US$)
Table 4: Telehealth Services Market End User Analysis 2023-2030 (US$)
Table 5: Telehealth Services Market Patent Analysis 2013-2023* (US$)
Table 6: Telehealth Services Market Financial Analysis 2023-2030 (US$)
Table 7: Telehealth Services Market Driver Analysis 2023-2030 (US$)
Table 8: Telehealth Services Market Challenges Analysis 2023-2030 (US$)
Table 9: Telehealth Services Market Constraint Analysis 2023-2030 (US$)
Table 10: Telehealth Services Market Supplier Bargaining Power Analysis 2023-2030 (US$)
Table 11: Telehealth Services Market Buyer Bargaining Power Analysis 2023-2030 (US$)
Table 12: Telehealth Services Market Threat of Substitutes Analysis 2023-2030 (US$)
Table 13: Telehealth Services Market Threat of New Entrants Analysis 2023-2030 (US$)
Table 14: Telehealth Services Market Degree of Competition Analysis 2023-2030 (US$)
Table 15: Telehealth Services Market Value Chain Analysis 2023-2030 (US$)
Table 16: Telehealth Services Market Pricing Analysis 2023-2030 (US$)
Table 17: Telehealth Services Market Opportunities Analysis 2023-2030 (US$)
Table 18: Telehealth Services Market Product Life Cycle Analysis 2023-2030 (US$)
Table 19: Telehealth Services Market Supplier Analysis 2023-2030 (US$)
Table 20: Telehealth Services Market Distributor Analysis 2023-2030 (US$)
Table 21: Telehealth Services Market Trend Analysis 2023-2030 (US$)
Table 22: Telehealth Services Market Size 2023 (US$)
Table 23: Telehealth Services Market Forecast Analysis 2023-2030 (US$)
Table 24: Telehealth Services Market Sales Forecast Analysis 2023-2030 (Units)
Table 25: Telehealth Services Market, Revenue & Volume, By Category, 2023-2030 ($)
Table 26: Telehealth Services Market By Category, Revenue & Volume, By Software, 2023-2030 ($)
Table 27: Telehealth Services Market By Category, Revenue & Volume, By Hardware, 2023-2030 ($)
Table 28: Telehealth Services Market, Revenue & Volume, By Delivery Mode, 2023-2030 ($)
Table 29: Telehealth Services Market By Delivery Mode, Revenue & Volume, By On Premise, 2023-2030 ($)
Table 30: Telehealth Services Market By Delivery Mode, Revenue & Volume, By Web, 2023-2030 ($)
Table 31: Telehealth Services Market By Delivery Mode, Revenue & Volume, By Cloud, 2023-2030 ($)
Table 32: Telehealth Services Market, Revenue & Volume, By End Use, 2023-2030 ($)
Table 33: Telehealth Services Market By End Use, Revenue & Volume, By Service Provider, 2023-2030 ($)
Table 34: Telehealth Services Market By End Use, Revenue & Volume, By Patient, 2023-2030 ($)
Table 35: North America Telehealth Services Market, Revenue & Volume, By Category, 2023-2030 ($)
Table 36: North America Telehealth Services Market, Revenue & Volume, By Delivery Mode, 2023-2030 ($)
Table 37: North America Telehealth Services Market, Revenue & Volume, By End Use, 2023-2030 ($)
Table 38: South america Telehealth Services Market, Revenue & Volume, By Category, 2023-2030 ($)
Table 39: South america Telehealth Services Market, Revenue & Volume, By Delivery Mode, 2023-2030 ($)
Table 40: South america Telehealth Services Market, Revenue & Volume, By End Use, 2023-2030 ($)
Table 41: Europe Telehealth Services Market, Revenue & Volume, By Category, 2023-2030 ($)
Table 42: Europe Telehealth Services Market, Revenue & Volume, By Delivery Mode, 2023-2030 ($)
Table 43: Europe Telehealth Services Market, Revenue & Volume, By End Use, 2023-2030 ($)
Table 44: APAC Telehealth Services Market, Revenue & Volume, By Category, 2023-2030 ($)
Table 45: APAC Telehealth Services Market, Revenue & Volume, By Delivery Mode, 2023-2030 ($)
Table 46: APAC Telehealth Services Market, Revenue & Volume, By End Use, 2023-2030 ($)
Table 47: Middle East & Africa Telehealth Services Market, Revenue & Volume, By Category, 2023-2030 ($)
Table 48: Middle East & Africa Telehealth Services Market, Revenue & Volume, By Delivery Mode, 2023-2030 ($)
Table 49: Middle East & Africa Telehealth Services Market, Revenue & Volume, By End Use, 2023-2030 ($)
Table 50: Russia Telehealth Services Market, Revenue & Volume, By Category, 2023-2030 ($)
Table 51: Russia Telehealth Services Market, Revenue & Volume, By Delivery Mode, 2023-2030 ($)
Table 52: Russia Telehealth Services Market, Revenue & Volume, By End Use, 2023-2030 ($)
Table 53: Israel Telehealth Services Market, Revenue & Volume, By Category, 2023-2030 ($)
Table 54: Israel Telehealth Services Market, Revenue & Volume, By Delivery Mode, 2023-2030 ($)
Table 55: Israel Telehealth Services Market, Revenue & Volume, By End Use, 2023-2030 ($)
Table 56: Top Companies 2023 (US$)Telehealth Services Market, Revenue & Volume
Table 57: Product Launch 2023-2030Telehealth Services Market, Revenue & Volume
Table 58: Mergers & Acquistions 2023-2030Telehealth Services Market, Revenue & Volume
List of Figures
Figure 1: Overview of Telehealth Services Market 2023-2030
Figure 2: Market Share Analysis for Telehealth Services Market 2023 (US$)
Figure 3: Product Comparison in Telehealth Services Market 2023-2030 (US$)
Figure 4: End User Profile for Telehealth Services Market 2023-2030 (US$)
Figure 5: Patent Application and Grant in Telehealth Services Market 2013-2023* (US$)
Figure 6: Top 5 Companies Financial Analysis in Telehealth Services Market 2023-2030 (US$)
Figure 7: Market Entry Strategy in Telehealth Services Market 2023-2030
Figure 8: Ecosystem Analysis in Telehealth Services Market 2023
Figure 9: Average Selling Price in Telehealth Services Market 2023-2030
Figure 10: Top Opportunites in Telehealth Services Market 2023-2030
Figure 11: Market Life Cycle Analysis in Telehealth Services Market
Figure 12: GlobalBy CategoryTelehealth Services Market Revenue, 2023-2030 ($)
Figure 13: GlobalBy Delivery ModeTelehealth Services Market Revenue, 2023-2030 ($)
Figure 14: GlobalBy End UseTelehealth Services Market Revenue, 2023-2030 ($)
Figure 15: Global Telehealth Services Market - By Geography
Figure 16: Global Telehealth Services Market Value & Volume, By Geography, 2023-2030 ($)
Figure 17: Global Telehealth Services Market CAGR, By Geography, 2023-2030 (%)
Figure 18: North America Telehealth Services Market Value & Volume, 2023-2030 ($)
Figure 19: US Telehealth Services Market Value & Volume, 2023-2030 ($)
Figure 20: US GDP and Population, 2023-2030 ($)
Figure 21: US GDP – Composition of 2023, By Sector of Origin
Figure 22: US Export and Import Value & Volume, 2023-2030 ($)
Figure 23: Canada Telehealth Services Market Value & Volume, 2023-2030 ($)
Figure 24: Canada GDP and Population, 2023-2030 ($)
Figure 25: Canada GDP – Composition of 2023, By Sector of Origin
Figure 26: Canada Export and Import Value & Volume, 2023-2030 ($)
Figure 27: Mexico Telehealth Services Market Value & Volume, 2023-2030 ($)
Figure 28: Mexico GDP and Population, 2023-2030 ($)
Figure 29: Mexico GDP – Composition of 2023, By Sector of Origin
Figure 30: Mexico Export and Import Value & Volume, 2023-2030 ($)
Figure 31: South America Telehealth Services Market Value & Volume, 2023-2030 ($)
Figure 32: Brazil Telehealth Services Market Value & Volume, 2023-2030 ($)
Figure 33: Brazil GDP and Population, 2023-2030 ($)
Figure 34: Brazil GDP – Composition of 2023, By Sector of Origin
Figure 35: Brazil Export and Import Value & Volume, 2023-2030 ($)
Figure 36: Venezuela Telehealth Services Market Value & Volume, 2023-2030 ($)
Figure 37: Venezuela GDP and Population, 2023-2030 ($)
Figure 38: Venezuela GDP – Composition of 2023, By Sector of Origin
Figure 39: Venezuela Export and Import Value & Volume, 2023-2030 ($)
Figure 40: Argentina Telehealth Services Market Value & Volume, 2023-2030 ($)
Figure 41: Argentina GDP and Population, 2023-2030 ($)
Figure 42: Argentina GDP – Composition of 2023, By Sector of Origin
Figure 43: Argentina Export and Import Value & Volume, 2023-2030 ($)
Figure 44: Ecuador Telehealth Services Market Value & Volume, 2023-2030 ($)
Figure 45: Ecuador GDP and Population, 2023-2030 ($)
Figure 46: Ecuador GDP – Composition of 2023, By Sector of Origin
Figure 47: Ecuador Export and Import Value & Volume, 2023-2030 ($)
Figure 48: Peru Telehealth Services Market Value & Volume, 2023-2030 ($)
Figure 49: Peru GDP and Population, 2023-2030 ($)
Figure 50: Peru GDP – Composition of 2023, By Sector of Origin
Figure 51: Peru Export and Import Value & Volume, 2023-2030 ($)
Figure 52: Colombia Telehealth Services Market Value & Volume, 2023-2030 ($)
Figure 53: Colombia GDP and Population, 2023-2030 ($)
Figure 54: Colombia GDP – Composition of 2023, By Sector of Origin
Figure 55: Colombia Export and Import Value & Volume, 2023-2030 ($)
Figure 56: Costa Rica Telehealth Services Market Value & Volume, 2023-2030 ($)
Figure 57: Costa Rica GDP and Population, 2023-2030 ($)
Figure 58: Costa Rica GDP – Composition of 2023, By Sector of Origin
Figure 59: Costa Rica Export and Import Value & Volume, 2023-2030 ($)
Figure 60: Europe Telehealth Services Market Value & Volume, 2023-2030 ($)
Figure 61: U.K Telehealth Services Market Value & Volume, 2023-2030 ($)
Figure 62: U.K GDP and Population, 2023-2030 ($)
Figure 63: U.K GDP – Composition of 2023, By Sector of Origin
Figure 64: U.K Export and Import Value & Volume, 2023-2030 ($)
Figure 65: Germany Telehealth Services Market Value & Volume, 2023-2030 ($)
Figure 66: Germany GDP and Population, 2023-2030 ($)
Figure 67: Germany GDP – Composition of 2023, By Sector of Origin
Figure 68: Germany Export and Import Value & Volume, 2023-2030 ($)
Figure 69: Italy Telehealth Services Market Value & Volume, 2023-2030 ($)
Figure 70: Italy GDP and Population, 2023-2030 ($)
Figure 71: Italy GDP – Composition of 2023, By Sector of Origin
Figure 72: Italy Export and Import Value & Volume, 2023-2030 ($)
Figure 73: France Telehealth Services Market Value & Volume, 2023-2030 ($)
Figure 74: France GDP and Population, 2023-2030 ($)
Figure 75: France GDP – Composition of 2023, By Sector of Origin
Figure 76: France Export and Import Value & Volume, 2023-2030 ($)
Figure 77: Netherlands Telehealth Services Market Value & Volume, 2023-2030 ($)
Figure 78: Netherlands GDP and Population, 2023-2030 ($)
Figure 79: Netherlands GDP – Composition of 2023, By Sector of Origin
Figure 80: Netherlands Export and Import Value & Volume, 2023-2030 ($)
Figure 81: Belgium Telehealth Services Market Value & Volume, 2023-2030 ($)
Figure 82: Belgium GDP and Population, 2023-2030 ($)
Figure 83: Belgium GDP – Composition of 2023, By Sector of Origin
Figure 84: Belgium Export and Import Value & Volume, 2023-2030 ($)
Figure 85: Spain Telehealth Services Market Value & Volume, 2023-2030 ($)
Figure 86: Spain GDP and Population, 2023-2030 ($)
Figure 87: Spain GDP – Composition of 2023, By Sector of Origin
Figure 88: Spain Export and Import Value & Volume, 2023-2030 ($)
Figure 89: Denmark Telehealth Services Market Value & Volume, 2023-2030 ($)
Figure 90: Denmark GDP and Population, 2023-2030 ($)
Figure 91: Denmark GDP – Composition of 2023, By Sector of Origin
Figure 92: Denmark Export and Import Value & Volume, 2023-2030 ($)
Figure 93: APAC Telehealth Services Market Value & Volume, 2023-2030 ($)
Figure 94: China Telehealth Services Market Value & Volume, 2023-2030
Figure 95: China GDP and Population, 2023-2030 ($)
Figure 96: China GDP – Composition of 2023, By Sector of Origin
Figure 97: China Export and Import Value & Volume, 2023-2030 ($)Telehealth Services Market China Export and Import Value & Volume, 2023-2030 ($)
Figure 98: Australia Telehealth Services Market Value & Volume, 2023-2030 ($)
Figure 99: Australia GDP and Population, 2023-2030 ($)
Figure 100: Australia GDP – Composition of 2023, By Sector of Origin
Figure 101: Australia Export and Import Value & Volume, 2023-2030 ($)
Figure 102: South Korea Telehealth Services Market Value & Volume, 2023-2030 ($)
Figure 103: South Korea GDP and Population, 2023-2030 ($)
Figure 104: South Korea GDP – Composition of 2023, By Sector of Origin
Figure 105: South Korea Export and Import Value & Volume, 2023-2030 ($)
Figure 106: India Telehealth Services Market Value & Volume, 2023-2030 ($)
Figure 107: India GDP and Population, 2023-2030 ($)
Figure 108: India GDP – Composition of 2023, By Sector of Origin
Figure 109: India Export and Import Value & Volume, 2023-2030 ($)
Figure 110: Taiwan Telehealth Services Market Value & Volume, 2023-2030 ($)
Figure 111: Taiwan GDP and Population, 2023-2030 ($)
Figure 112: Taiwan GDP – Composition of 2023, By Sector of Origin
Figure 113: Taiwan Export and Import Value & Volume, 2023-2030 ($)
Figure 114: Malaysia Telehealth Services Market Value & Volume, 2023-2030 ($)
Figure 115: Malaysia GDP and Population, 2023-2030 ($)
Figure 116: Malaysia GDP – Composition of 2023, By Sector of Origin
Figure 117: Malaysia Export and Import Value & Volume, 2023-2030 ($)
Figure 118: Hong Kong Telehealth Services Market Value & Volume, 2023-2030 ($)
Figure 119: Hong Kong GDP and Population, 2023-2030 ($)
Figure 120: Hong Kong GDP – Composition of 2023, By Sector of Origin
Figure 121: Hong Kong Export and Import Value & Volume, 2023-2030 ($)
Figure 122: Middle East & Africa Telehealth Services Market Middle East & Africa 3D Printing Market Value & Volume, 2023-2030 ($)
Figure 123: Russia Telehealth Services Market Value & Volume, 2023-2030 ($)
Figure 124: Russia GDP and Population, 2023-2030 ($)
Figure 125: Russia GDP – Composition of 2023, By Sector of Origin
Figure 126: Russia Export and Import Value & Volume, 2023-2030 ($)
Figure 127: Israel Telehealth Services Market Value & Volume, 2023-2030 ($)
Figure 128: Israel GDP and Population, 2023-2030 ($)
Figure 129: Israel GDP – Composition of 2023, By Sector of Origin
Figure 130: Israel Export and Import Value & Volume, 2023-2030 ($)
Figure 131: Entropy Share, By Strategies, 2023-2030* (%)Telehealth Services Market
Figure 132: Developments, 2023-2030*Telehealth Services Market
Figure 133: Company 1 Telehealth Services Market Net Revenue, By Years, 2023-2030* ($)
Figure 134: Company 1 Telehealth Services Market Net Revenue Share, By Business segments, 2023 (%)
Figure 135: Company 1 Telehealth Services Market Net Sales Share, By Geography, 2023 (%)
Figure 136: Company 2 Telehealth Services Market Net Revenue, By Years, 2023-2030* ($)
Figure 137: Company 2 Telehealth Services Market Net Revenue Share, By Business segments, 2023 (%)
Figure 138: Company 2 Telehealth Services Market Net Sales Share, By Geography, 2023 (%)
Figure 139: Company 3 Telehealth Services Market Net Revenue, By Years, 2023-2030* ($)
Figure 140: Company 3 Telehealth Services Market Net Revenue Share, By Business segments, 2023 (%)
Figure 141: Company 3 Telehealth Services Market Net Sales Share, By Geography, 2023 (%)
Figure 142: Company 4 Telehealth Services Market Net Revenue, By Years, 2023-2030* ($)
Figure 143: Company 4 Telehealth Services Market Net Revenue Share, By Business segments, 2023 (%)
Figure 144: Company 4 Telehealth Services Market Net Sales Share, By Geography, 2023 (%)
Figure 145: Company 5 Telehealth Services Market Net Revenue, By Years, 2023-2030* ($)
Figure 146: Company 5 Telehealth Services Market Net Revenue Share, By Business segments, 2023 (%)
Figure 147: Company 5 Telehealth Services Market Net Sales Share, By Geography, 2023 (%)
Figure 148: Company 6 Telehealth Services Market Net Revenue, By Years, 2023-2030* ($)
Figure 149: Company 6 Telehealth Services Market Net Revenue Share, By Business segments, 2023 (%)
Figure 150: Company 6 Telehealth Services Market Net Sales Share, By Geography, 2023 (%)
Figure 151: Company 7 Telehealth Services Market Net Revenue, By Years, 2023-2030* ($)
Figure 152: Company 7 Telehealth Services Market Net Revenue Share, By Business segments, 2023 (%)
Figure 153: Company 7 Telehealth Services Market Net Sales Share, By Geography, 2023 (%)
Figure 154: Company 8 Telehealth Services Market Net Revenue, By Years, 2023-2030* ($)
Figure 155: Company 8 Telehealth Services Market Net Revenue Share, By Business segments, 2023 (%)
Figure 156: Company 8 Telehealth Services Market Net Sales Share, By Geography, 2023 (%)
Figure 157: Company 9 Telehealth Services Market Net Revenue, By Years, 2023-2030* ($)
Figure 158: Company 9 Telehealth Services Market Net Revenue Share, By Business segments, 2023 (%)
Figure 159: Company 9 Telehealth Services Market Net Sales Share, By Geography, 2023 (%)
Figure 160: Company 10 Telehealth Services Market Net Revenue, By Years, 2023-2030* ($)
Figure 161: Company 10 Telehealth Services Market Net Revenue Share, By Business segments, 2023 (%)
Figure 162: Company 10 Telehealth Services Market Net Sales Share, By Geography, 2023 (%)
Figure 163: Company 11 Telehealth Services Market Net Revenue, By Years, 2023-2030* ($)
Figure 164: Company 11 Telehealth Services Market Net Revenue Share, By Business segments, 2023 (%)
Figure 165: Company 11 Telehealth Services Market Net Sales Share, By Geography, 2023 (%)
Figure 166: Company 12 Telehealth Services Market Net Revenue, By Years, 2023-2030* ($)
Figure 167: Company 12 Telehealth Services Market Net Revenue Share, By Business segments, 2023 (%)
Figure 168: Company 12 Telehealth Services Market Net Sales Share, By Geography, 2023 (%)
Figure 169: Company 13 Telehealth Services Market Net Revenue, By Years, 2023-2030* ($)
Figure 170: Company 13 Telehealth Services Market Net Revenue Share, By Business segments, 2023 (%)
Figure 171: Company 13 Telehealth Services Market Net Sales Share, By Geography, 2023 (%)
Figure 172: Company 14 Telehealth Services Market Net Revenue, By Years, 2023-2030* ($)
Figure 173: Company 14 Telehealth Services Market Net Revenue Share, By Business segments, 2023 (%)
Figure 174: Company 14 Telehealth Services Market Net Sales Share, By Geography, 2023 (%)
Figure 175: Company 15 Telehealth Services Market Net Revenue, By Years, 2023-2030* ($)
Figure 176: Company 15 Telehealth Services Market Net Revenue Share, By Business segments, 2023 (%)
Figure 177: Company 15 Telehealth Services Market Net Sales Share, By Geography, 2023 (%)