 Email
Email Print
Print


Wax Emulsion Market Overview
Wax Emulsion Market is forecast to reach $957.741 million by 2030, after growing at a CAGR of 6.3% during 2024-2030. Wax emulsion is a stable mixture of one or more waxes in water. Waxes are immiscible, but they can be brought together stably by using surfactants or emulsifiers. Surfactants and emulsifiers can be cationic, anionic or non-ionic. Extensive use of wax emulsion in paints and coatings for enhanced properties such as matting & gloss, hydrophobicity, soft-touch, abrasion & rub resistance augments the market growth. Wax emulsions are also used in paper sizing and in textile industries for waterproofing of textile substrates. Surging demand for wax emulsions like synthetic wax, carnauba, candelilla waxes, alcohol ethoxylates from emerging countries like Brazil, Argentina, and India further drives the growth of the market.
The emergence of COVID-19
The outbreak of COVID-19 has negatively impacted the wax emulsion market. The abrupt closure of production centers in China, and its impact caused chaos among global auto manufacturers in European Union, US, India, and South America region. For instance, Toyota Motor Corporation reported a YoY sales decline of 26%, May’s unit sales were almost double that of April, which fell 56% YoY.
Additionally, Sales of new-energy vehicles (NEVs) in China in June fell 35% YoY to 85,600 units, following a drop of 26% in May and 30% in April. The demand for wax emulsion lowered due to the declining automotive industry. In addition, a decrease in purchasing capital lowered construction activities and demand for apparel. According to the National Bureau of Statistics of China, the online retail sales of clothing goods decreased by 18.1 percent, substantially hampering the growth of the wax emulsion market.
Wax Emulsion Market Report Coverage
The report: “Wax Emulsion Market – Forecast (2024-2030)”, by IndustryARC, covers an in-depth analysis of the following segments of the Wax Emulsion Market.
By Type: Natural (Animal, Vegetable and Minerals), and Synthetic (Polyethylene, Polypropylene, Paraffin, poly tetrafluoroethylene (PTFE), Fischer-Tropsch, and Others)
By Application: Wood Coatings, Adhesive & Sealants, Printing Inks, Fiberglass Insulation, Metal Polish, Lubricants, Textile Finish, cold creams, lipsticks, Tires, and Others
By End-Use Industry: Paint & Coatings, Building & Construction (Residential, Commercial, Industrial, and Infrastructure), Textile & Leather, Pulp & Paper, Cosmetics and Personal care, Automotive (Passenger Cars, Light Commercial Vehicle, and Heavy Duty Vehicles), Packaging, Wood Processing, and Others.
By Geography: North America (U.S., Canada, and Mexico), Europe (UK, Germany, France, Italy, Netherlands, Spain, Russia, Belgium, and Rest of Europe), Asia-Pacific (China, Japan, India, South Korea, Australia & New Zealand, Indonesia, Taiwan, Malaysia, and Rest of APAC), South America (Brazil, Argentina, Colombia, Chile, and Rest of South America), Rest of the World (the Middle East, and Africa)
Key Takeaways
● The U.K has shown significant growth in the wax emulsion market due to its high demand from wood processing industries for the protection of woods from water and prevent rotting.
● Rising popularity of natural waxes such as beeswax, Carnauba, synthesized from plants and animal drives the market growth.
For More Details on This Report - Request for Sample
Wax Emulsion Market Segment Analysis – By Type
Synthetic segment held the largest share of more than 60.23% in the Wax Emulsion market in 2023. Synthetic wax emulsions are synthesized from synthetic polymers such as polyethylene, polypropylene, polytetrafluoroethylene, and many more. Synthetic wax emulsions are long-lasting, abrasion-resistant and provide good protection from contaminants like dust, grime, and corrosion. Thus, the availability of synthetic wax emulsion with varied properties makes it suitable for numerous applications including paints & coatings, cosmetics, and construction, significantly augmenting the market growth. However, increasing environmental concerns are driving the demand for natural wax emulsions such as Lanolin, Beeswax, Carnauba, and Candellila waxes.
Polyethylene wax segment consists of low-density polyethylene (LDPE) and High Density Polyethylene (HDPE) and is obtained by polymerization of Ethylene monomers. Physical attributes such as water-repellence, abrasion resistance, slip control, lubrication, and anti-blocking are contributing to the growth of polyethylene wax emulsion. Polyethylene wax emulsion manufactures more easily and is cost-effective. Surging use of polyethylene wax emulsion in lithographic and flexographic inks for an improved rub and mar resistance and slip characteristics also aids the market growth.
Wax Emulsion Market Segment Analysis - Application
Wood Coatings segment is projected to witness the highest CAGR of 6.4% during the forecast period. Wax emulsions are extensively used in paints & coatings as they provide a consistent neutral color and offer formulators maximum flexibility in pigmented applications. Wax emulsions also improve the durability of water-based paints, by offering excellent scratch- and abrasion resistance. An increase in building and constructions has proliferated the demand for paint & coatings.
Hence, surging demand for paints and coatings as a consequence of huge constructional activities may bolster the growth of the wax emulsion market.
Wax Emulsion Market Segment Analysis - End-Use Industry
Textile and leather segment held the largest share of more than 26% in the wax emulsion market in 2023. Wax emulsions are used in the textile and leather industry for waterproofing of textile and leather substrates, modifying the frictional properties of fibers, yarns, and sewing threads for better processability, and for enhancing the performance of finishing compounds such as softeners, silicones, and resins. They also provide superior fabric properties such as improved flex abrasion resistance, tear strength, and sewability. Owing to the above benefits the demand for wax emulsions is increasing from textile and leather industries. The Advanced Functional Fabrics of America Institute (AFFOA) brought over $300 million in public-private investment to develop futuristic fabrics and textiles helping to accelerate the revival of textile manufacturing in the United States. The thriving textile industry across the globe and vast technological advances may boost the global demand for wax emulsion.
Wax Emulsion Market Segment Analysis - By Geography
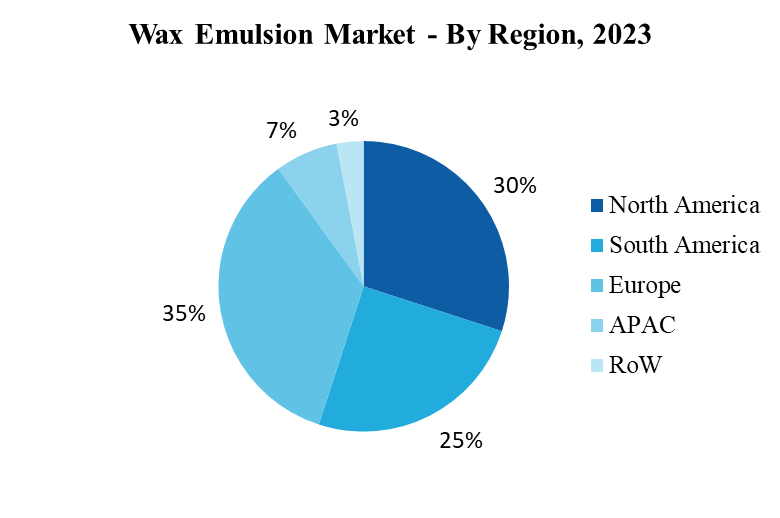
Asia Pacific dominated the Wax Emulsion market with a share of more than 41% in 2023 followed by North America and Europe. Increasing per-capita income and adoption of western culture in emerging economic nations especially in China, and India has boosted the growth of fashion industry and also increased the demand for leather. Increasing demand for apparel and expansion of textile industries across the country is also aiding the growth of market.
With the rising popularity of functional textiles that offer additional properties like water repellency, UV protection, and stain resistance, the demand for wax emulsions in textile coatings and finishes is on the rise. The growing demand for leather and apparel products in emerging markets, coupled with increasing disposable incomes and changing consumer preferences, presents significant opportunities for wax emulsion manufacturers to expand their presence and capture a larger market share in these regions. Thus huge spending on apparels and leather articles escalate the growth of the wax emulsion market.
Wax Emulsion Market Drivers
Growing demand from automotive industries
Wax Emulsions are water repellent, hence its use in automotive paints and polishes prevents water from accumulating in nooks and crannies of car’s surface thereby reducing the risk of corrosion and prevents the formation of water stains and spots on the surface. Wax emulsion are also used as lubricants and in car’s interior leather for matt effect and smoothness. Increase in standard of living coupled with high disposable income boosts the demand for automotive.
Automotive manufacturers prioritize the aesthetic appeal of vehicles to attract customers. Wax emulsions contribute to achieving a glossy finish and enhancing the appearance of automotive coatings, making vehicles more visually appealing to consumers. Continuous innovations in wax emulsion formulations cater to the evolving needs of the automotive industry. Advanced wax emulsions offer improved performance characteristics such as enhanced durability, scratch resistance, and water repellency, meeting the stringent requirements of automotive manufacturers and contributing to market growth. Thus rise in automotive demand augments the growth of the wax emulsion market.
Increasing use of paper and pulp as a substitute for plastics
Increasing environmental concerns and the use of paper as a substitute for plastics drive the growth of the wax emulsion market. In paper coatings, the wax emulsion is added to the coating mixture to reduce dusting during calendaring, to increase water repellency, to improve flexibility, and to raise gloss. When used as sizing in the paper, the wax emulsion helps prevent aqueous solutions, such as ink, from soaking into the paper and paperboard. According to an environmental paper network (EPN), paper use is steadily increasing year on year and exceeded 412 million tons per year in 2023. Also, total paper and paperboard demand for domestic applications such as tissue paper, newsprint, boxboard, etc. reached to 26,592 thousand metric tons in 2023 in Japan, according to the Japan paper association. Therefore, accelerating use for paper augments the demand for wax emulsions for paper sizing.
Wax Emulsion Market - Challenges
Volatility in prices of raw material
The raw materials often used for manufacturing waxes emulsion such as paraffin, polyethylene, and polypropylene are derived from the crude oil. So, fluctuation in oil prices also hampers the prices of wax emulsions. According to, BP Statistical Review of World Energy, in the recent year there is been an increase in the price volatility of crude oil, such as the crude oil price increased from $81.12 in 2022 to a price of $97.67 per barrel in the financial year 2023 hovering a high price rise, and because of this uncertainty in crude oil prices, the price of wax emulsions also increases. The volatility in crude oil prices is expected to be a significant challenge for wax emulsion manufacturers during the forecast period.
Wax Emulsion Market Landscape
Technology launches, acquisitions and R&D activities are key strategies adopted by players in the Wax Emulsion market report. Major players in the Wax Emulsion market are:
1. The Dow Chemical Company
2. Exxon Mobil Corporation
3. Momentive Performance Materials Inc.
4. Michelman, Inc.
5. Lubrizol Corporation
6. BASF SE
7. Croda International Plc
8. Arkema SA
9. Lanxess AG
10. Huntsman Corporation and others
Acquisitions / Technology Launches:
● Münzing Group’s Production Plant Inauguration (July 21, 2022): The Münzing Group inaugurated a state-of-the-art production plant in Zeitz Chemical and Industrial Park. This significant investment of EUR 50 million resulted in the creation of 40 new jobs.
For more Chemicals and Materials Market reports, please click here
1. Wax Emulsion Market- Market Overview
1.1 Definitions and Scope
2. Wax Emulsion Market - Executive Summary
2.1 Key Trends by Type
2.2 Key Trends by Application
2.3 Key Trends by End-Use Industry
2.4 Key Trends by Geography
3. Wax Emulsion Market – Comparative analysis
3.1 Market Share Analysis- Major Companies
3.2 Product Benchmarking- Major Companies
3.3 Top 5 Financials Analysis
3.4 Patent Analysis- Major Companies
3.5 Pricing Analysis (ASPs will be provided)
4. Wax Emulsion Market - Startup companies Scenario Premium
4.1 Major startup company analysis:
4.1.1 Investment
4.1.2 Revenue
4.1.3 Product portfolio
4.1.4 Venture Capital and Funding Scenario
5. Wax Emulsion Market – Industry Market Entry Scenario Premium
5.1 Regulatory Framework Overview
5.2 New Business and Ease of Doing Business Index
5.3 Successful Venture Profiles
5.4 Customer Analysis – Major companies
6. Wax Emulsion Market - Market Forces
6.1 Market Drivers
6.2 Market Constraints
6.3 Porters Five Force Model
6.3.1 Bargaining Power of Suppliers
6.3.2 Bargaining Powers of Buyers
6.3.3 Threat of New Entrants
6.3.4 Competitive Rivalry
6.3.5 Threat of Substitutes
7. Wax Emulsion Market – Strategic Analysis
7.1 Value Chain Analysis
7.2 Opportunity Analysis
7.3 Product/Market Life Cycle
7.4 Distributor Analysis – Major Companies
8. Wax Emulsion Market – By Type (Market Size -$Million/Billion)
8.1 Natural
8.1.1 Animal Based
8.1.2 Vegetable
8.1.3 Minerals Based
8.2 Synthetic
8.2.1 Polyethylene
8.2.2 Polypropylene
8.2.3 Paraffin
8.2.4 poly tetrafluoroethylene (PTFE)
8.2.5 Fischer-Tropsch
8.2.6 Others
9. Wax Emulsion Market – By Application (Market Size -$Million/Billion)
9.1 Wood Coatings
9.2 Adhesive & Sealants
9.3 Printing Inks
9.4 Fiberglass Insulation
9.5 Metal Polish
9.6 Lubricants
9.7 Textile Finish
9.8 cold creams
9.9 lipsticks
9.10 Tires
9.11 Others
10. Wax Emulsion Market– By End-Use Industry (Market Size -$Million/Billion)
10.1 Paints and Coatings
10.2 Automotive
10.2.1 Passenger Cars
10.2.2 Light Commercial Vehicles (LCV)
10.2.3 Heavy Commercial Vehicles (HCV)
10.3 Aerospace
10.3.1Commercial
10.3.2 Military
10.3.3 Others
10.4 Building & Construction
10.4.1 Residential
10.4.2 Commercial
10.4.3 Infrastructural
10.4.4 Industrial
10.5 Packaging
10.6 Wood Processing
10.7 Textile & Leather
10.8 Pulp & Paper
10.9 Cosmetics and Personal Care
10.10 Others
11. Wax Emulsion Market - By Geography (Market Size -$Million/Billion)
11.1 North America
11.1.1 U.S
11.1.2 Canada
11.1.3 Mexico
11.2 Europe
11.2.1 UK
11.2.2 Germany
11.2.3 France
11.2.4 Italy
11.2.5 Netherlands
11.2.6 Spain
11.2.7 Russia
11.2.8 Belgium
11.2.9 Rest of Europe
11.3 Asia-Pacific
11.3.1 China
11.3.2 Japan
11.3.3 India
11.3.4 South Korea
11.3.5 Australia and New Zealand
11.3.6 Indonesia
11.3.7 Taiwan
11.3.8 Malaysia
11.3.9 Rest of APAC
11.4 South America
11.4.1 Brazil
11.4.2 Argentina
11.4.3 Colombia
11.4.4 Chile
11.4.5 Rest of South America
11.5 Rest of the World
11.5.1 Middle East
11.5.1.1 Saudi Arabia
11.5.1.2 U.A.E
11.5.1.3 Israel
11.5.1.4 Rest of the Middle East
11.5.2 Africa
11.5.2.1 South Africa
11.5.2.2 Nigeria
11.5.2.3 Rest of Africa
12. Wax Emulsion Market – Entropy
12.1 New Product Launches
12.2 M&As, Collaborations, JVs and Partnerships
13. Wax Emulsion Market – Market Share Analysis
13.1 Market Share at Global Level - Major companies
13.2 Market Share by Key Region - Major companies
13.3 Market Share by Key Country - Major companies
13.4 Market Share by Key Application - Major companies
13.5 Market Share by Key Product Type/Product category - Major companies
14. Wax Emulsion Market – Key Company List by Country Premium
15. Wax Emulsion Market Company Analysis - Business Overview, Product Portfolio, Financials, and Developments
15.1. The Dow Chemical Company
15.2. Exxon Mobil Corporation
15.3. Momentive Performance Materials Inc.
15.4. Michelman, Inc.
15.5. Lubrizol Corporation
15.6. BASF SE
15.7. Croda International Plc
15.8. Arkema SA
15.9. Lanxess AG
15.10. Huntsman Corporation and others and more
15. Wax Emulsion Market- Acquisitions/Technology Launches
List of Tables:
Table 1: Wax Emulsion Market Overview 2023-2030
Table 2: Wax Emulsion Market Leader Analysis 2023-2030 (US$)
Table 3: Wax Emulsion Market Product Analysis 2023-2030 (US$)
Table 4: Wax Emulsion Market End User Analysis 2023-2030 (US$)
Table 5: Wax Emulsion Market Patent Analysis 2013-2023* (US$)
Table 6: Wax Emulsion Market Financial Analysis 2023-2030 (US$)
Table 7: Wax Emulsion Market Driver Analysis 2023-2030 (US$)
Table 8: Wax Emulsion Market Challenges Analysis 2023-2030 (US$)
Table 9: Wax Emulsion Market Constraint Analysis 2023-2030 (US$)
Table 10: Wax Emulsion Market Supplier Bargaining Power Analysis 2023-2030 (US$)
Table 11: Wax Emulsion Market Buyer Bargaining Power Analysis 2023-2030 (US$)
Table 12: Wax Emulsion Market Threat of Substitutes Analysis 2023-2030 (US$)
Table 13: Wax Emulsion Market Threat of New Entrants Analysis 2023-2030 (US$)
Table 14: Wax Emulsion Market Degree of Competition Analysis 2023-2030 (US$)
Table 15: Wax Emulsion Market Value Chain Analysis 2023-2030 (US$)
Table 16: Wax Emulsion Market Pricing Analysis 2023-2030 (US$)
Table 17: Wax Emulsion Market Opportunities Analysis 2023-2030 (US$)
Table 18: Wax Emulsion Market Product Life Cycle Analysis 2023-2030 (US$)
Table 19: Wax Emulsion Market Supplier Analysis 2023-2030 (US$)
Table 20: Wax Emulsion Market Distributor Analysis 2023-2030 (US$)
Table 21: Wax Emulsion Market Trend Analysis 2023-2030 (US$)
Table 22: Wax Emulsion Market Size 2023 (US$)
Table 23: Wax Emulsion Market Forecast Analysis 2023-2030 (US$)
Table 24: Wax Emulsion Market Sales Forecast Analysis 2023-2030 (Units)
Table 25: Wax Emulsion Market, Revenue & Volume,By Type, 2023-2030 ($)
Table 26: Wax Emulsion MarketBy Type, Revenue & Volume,By Polyethylene, 2023-2030 ($)
Table 27: Wax Emulsion MarketBy Type, Revenue & Volume,By Paraffin, 2023-2030 ($)
Table 28: Wax Emulsion MarketBy Type, Revenue & Volume,By Carnauba, 2023-2030 ($)
Table 29: Wax Emulsion MarketBy Type, Revenue & Volume,By Polypropylene, 2023-2030 ($)
Table 30: Wax Emulsion Market, Revenue & Volume,By Material Base, 2023-2030 ($)
Table 31: Wax Emulsion MarketBy Material Base, Revenue & Volume,By Synthetic, 2023-2030 ($)
Table 32: Wax Emulsion MarketBy Material Base, Revenue & Volume,By Natural, 2023-2030 ($)
Table 33: Wax Emulsion Market, Revenue & Volume,By End-Use Industry , 2023-2030 ($)
Table 34: Wax Emulsion MarketBy End-Use Industry , Revenue & Volume,By Paints & Coatings, 2023-2030 ($)
Table 35: Wax Emulsion MarketBy End-Use Industry , Revenue & Volume,By Adhesives & Sealants, 2023-2030 ($)
Table 36: Wax Emulsion MarketBy End-Use Industry , Revenue & Volume,By Cosmetics, 2023-2030 ($)
Table 37: Wax Emulsion MarketBy End-Use Industry , Revenue & Volume,By Textiles, 2023-2030 ($)
Table 38: North America Wax Emulsion Market, Revenue & Volume,By Type, 2023-2030 ($)
Table 39: North America Wax Emulsion Market, Revenue & Volume,By Material Base, 2023-2030 ($)
Table 40: North America Wax Emulsion Market, Revenue & Volume,By End-Use Industry , 2023-2030 ($)
Table 41: South america Wax Emulsion Market, Revenue & Volume,By Type, 2023-2030 ($)
Table 42: South america Wax Emulsion Market, Revenue & Volume,By Material Base, 2023-2030 ($)
Table 43: South america Wax Emulsion Market, Revenue & Volume,By End-Use Industry , 2023-2030 ($)
Table 44: Europe Wax Emulsion Market, Revenue & Volume,By Type, 2023-2030 ($)
Table 45: Europe Wax Emulsion Market, Revenue & Volume,By Material Base, 2023-2030 ($)
Table 46: Europe Wax Emulsion Market, Revenue & Volume,By End-Use Industry , 2023-2030 ($)
Table 47: APAC Wax Emulsion Market, Revenue & Volume,By Type, 2023-2030 ($)
Table 48: APAC Wax Emulsion Market, Revenue & Volume,By Material Base, 2023-2030 ($)
Table 49: APAC Wax Emulsion Market, Revenue & Volume,By End-Use Industry , 2023-2030 ($)
Table 50: Middle East & Africa Wax Emulsion Market, Revenue & Volume,By Type, 2023-2030 ($)
Table 51: Middle East & Africa Wax Emulsion Market, Revenue & Volume,By Material Base, 2023-2030 ($)
Table 52: Middle East & Africa Wax Emulsion Market, Revenue & Volume,By End-Use Industry , 2023-2030 ($)
Table 53: Russia Wax Emulsion Market, Revenue & Volume,By Type, 2023-2030 ($)
Table 54: Russia Wax Emulsion Market, Revenue & Volume,By Material Base, 2023-2030 ($)
Table 55: Russia Wax Emulsion Market, Revenue & Volume,By End-Use Industry , 2023-2030 ($)
Table 56: Israel Wax Emulsion Market, Revenue & Volume,By Type, 2023-2030 ($)
Table 57: Israel Wax Emulsion Market, Revenue & Volume,By Material Base, 2023-2030 ($)
Table 58: Israel Wax Emulsion Market, Revenue & Volume,By End-Use Industry , 2023-2030 ($)
Table 59: Top Companies 2023 (US$)Wax Emulsion Market, Revenue & Volume
Table 60: Product Launch 2023-2030Wax Emulsion Market, Revenue & Volume
Table 61: Mergers & Acquistions 2023-2030Wax Emulsion Market, Revenue & Volume
List of Figures:
Figure 1: Overview of Wax Emulsion Market 2023-2030
Figure 2: Market Share Analysis for Wax Emulsion Market 2023 (US$)
Figure 3: Product Comparison in Wax Emulsion Market 2023-2030 (US$)
Figure 4: End User Profile for Wax Emulsion Market 2023-2030 (US$)
Figure 5: Patent Application and Grant in Wax Emulsion Market 2013-2023* (US$)
Figure 6: Top 5 Companies Financial Analysis in Wax Emulsion Market 2023-2030 (US$)
Figure 7: Market Entry Strategy in Wax Emulsion Market 2023-2030
Figure 8: Ecosystem Analysis in Wax Emulsion Market2023
Figure 9: Average Selling Price in Wax Emulsion Market 2023-2030
Figure 10: Top Opportunites in Wax Emulsion Market 2023-2030
Figure 11: Market Life Cycle Analysis in Wax Emulsion Market
Figure 12: GlobalBy TypeWax Emulsion Market Revenue, 2023-2030 ($)
Figure 13: GlobalBy Material BaseWax Emulsion Market Revenue, 2023-2030 ($)
Figure 14: GlobalBy End-Use Industry Wax Emulsion Market Revenue, 2023-2030 ($)
Figure 15: Global Wax Emulsion Market - By Geography
Figure 16: Global Wax Emulsion Market Value & Volume, By Geography, 2023-2030 ($)
Figure 17: Global Wax Emulsion Market CAGR, By Geography, 2023-2030 (%)
Figure 18: North America Wax Emulsion Market Value & Volume, 2023-2030 ($)
Figure 19: US Wax Emulsion Market Value & Volume, 2023-2030 ($)
Figure 20: US GDP and Population, 2023-2030 ($)
Figure 21: US GDP – Composition of 2023, By Sector of Origin
Figure 22: US Export and Import Value & Volume, 2023-2030 ($)
Figure 23: Canada Wax Emulsion Market Value & Volume, 2023-2030 ($)
Figure 24: Canada GDP and Population, 2023-2030 ($)
Figure 25: Canada GDP – Composition of 2023, By Sector of Origin
Figure 26: Canada Export and Import Value & Volume, 2023-2030 ($)
Figure 27: Mexico Wax Emulsion Market Value & Volume, 2023-2030 ($)
Figure 28: Mexico GDP and Population, 2023-2030 ($)
Figure 29: Mexico GDP – Composition of 2023, By Sector of Origin
Figure 30: Mexico Export and Import Value & Volume, 2023-2030 ($)
Figure 31: South America Wax Emulsion MarketSouth America 3D Printing Market Value & Volume, 2023-2030 ($)
Figure 32: Brazil Wax Emulsion Market Value & Volume, 2023-2030 ($)
Figure 33: Brazil GDP and Population, 2023-2030 ($)
Figure 34: Brazil GDP – Composition of 2023, By Sector of Origin
Figure 35: Brazil Export and Import Value & Volume, 2023-2030 ($)
Figure 36: Venezuela Wax Emulsion Market Value & Volume, 2023-2030 ($)
Figure 37: Venezuela GDP and Population, 2023-2030 ($)
Figure 38: Venezuela GDP – Composition of 2023, By Sector of Origin
Figure 39: Venezuela Export and Import Value & Volume, 2023-2030 ($)List of Tables:
Figure 40: Argentina Wax Emulsion Market Value & Volume, 2023-2030 ($)
Figure 41: Argentina GDP and Population, 2023-2030 ($)
Figure 42: Argentina GDP – Composition of 2023, By Sector of Origin
Figure 43: Argentina Export and Import Value & Volume, 2023-2030 ($)
Figure 44: Ecuador Wax Emulsion Market Value & Volume, 2023-2030 ($)
Figure 45: Ecuador GDP and Population, 2023-2030 ($)
Figure 46: Ecuador GDP – Composition of 2023, By Sector of Origin
Figure 47: Ecuador Export and Import Value & Volume, 2023-2030 ($)
Figure 48: Peru Wax Emulsion Market Value & Volume, 2023-2030 ($)
Figure 49: Peru GDP and Population, 2023-2030 ($)
Figure 50: Peru GDP – Composition of 2023, By Sector of Origin
Figure 51: Peru Export and Import Value & Volume, 2023-2030 ($)
Figure 52: Colombia Wax Emulsion Market Value & Volume, 2023-2030 ($)
Figure 53: Colombia GDP and Population, 2023-2030 ($)
Figure 54: Colombia GDP – Composition of 2023, By Sector of Origin
Figure 55: Colombia Export and Import Value & Volume, 2023-2030 ($)
Figure 56: Costa Rica Wax Emulsion MarketCosta Rica 3D Printing Market Value & Volume, 2023-2030 ($)
Figure 57: Costa Rica GDP and Population, 2023-2030 ($)
Figure 58: Costa Rica GDP – Composition of 2023, By Sector of Origin
Figure 59: Costa Rica Export and Import Value & Volume, 2023-2030 ($)
Figure 60: Europe Wax Emulsion Market Value & Volume, 2023-2030 ($)
Figure 61: U.K Wax Emulsion Market Value & Volume, 2023-2030 ($)
Figure 62: U.K GDP and Population, 2023-2030 ($)
Figure 63: U.K GDP – Composition of 2023, By Sector of Origin
Figure 64: U.K Export and Import Value & Volume, 2023-2030 ($)
Figure 65: Germany Wax Emulsion Market Value & Volume, 2023-2030 ($)
Figure 66: Germany GDP and Population, 2023-2030 ($)
Figure 67: Germany GDP – Composition of 2023, By Sector of Origin
Figure 68: Germany Export and Import Value & Volume, 2023-2030 ($)
Figure 69: Italy Wax Emulsion Market Value & Volume, 2023-2030 ($)
Figure 70: Italy GDP and Population, 2023-2030 ($)
Figure 71: Italy GDP – Composition of 2023, By Sector of Origin
Figure 72: Italy Export and Import Value & Volume, 2023-2030 ($)
Figure 73: France Wax Emulsion Market Value & Volume, 2023-2030 ($)
Figure 74: France GDP and Population, 2023-2030 ($)
Figure 75: France GDP – Composition of 2023, By Sector of Origin
Figure 76: France Export and Import Value & Volume, 2023-2030 ($)
Figure 77: Netherlands Wax Emulsion Market Value & Volume, 2023-2030 ($)
Figure 78: Netherlands GDP and Population, 2023-2030 ($)
Figure 79: Netherlands GDP – Composition of 2023, By Sector of Origin
Figure 80: Netherlands Export and Import Value & Volume, 2023-2030 ($)
Figure 81: Belgium Wax Emulsion Market Value & Volume, 2023-2030 ($)
Figure 82: Belgium GDP and Population, 2023-2030 ($)
Figure 83: Belgium GDP – Composition of 2023, By Sector of Origin
Figure 84: Belgium Export and Import Value & Volume, 2023-2030 ($)
Figure 85: Spain Wax Emulsion Market Value & Volume, 2023-2030 ($)
Figure 86: Spain GDP and Population, 2023-2030 ($)
Figure 87: Spain GDP – Composition of 2023, By Sector of Origin
Figure 88: Spain Export and Import Value & Volume, 2023-2030 ($)
Figure 89: Denmark Wax Emulsion Market Value & Volume, 2023-2030 ($)
Figure 90: Denmark GDP and Population, 2023-2030 ($)
Figure 91: Denmark GDP – Composition of 2023, By Sector of Origin
Figure 92: Denmark Export and Import Value & Volume, 2023-2030 ($)
Figure 93: APAC Wax Emulsion Market Value & Volume, 2023-2030 ($)
Figure 94: China Wax Emulsion MarketValue & Volume, 2023-2030
Figure 95: China GDP and Population, 2023-2030 ($)
Figure 96: China GDP – Composition of 2023, By Sector of Origin
Figure 97: China Export and Import Value & Volume, 2023-2030 ($)Wax Emulsion MarketChina Export and Import Value & Volume, 2023-2030 ($)
Figure 98: Australia Wax Emulsion Market Value & Volume, 2023-2030 ($)
Figure 99: Australia GDP and Population, 2023-2030 ($)
Figure 100: Australia GDP – Composition of 2023, By Sector of Origin
Figure 101: Australia Export and Import Value & Volume, 2023-2030 ($)
Figure 102: South Korea Wax Emulsion Market Value & Volume, 2023-2030 ($)
Figure 103: South Korea GDP and Population, 2023-2030 ($)
Figure 104: South Korea GDP – Composition of 2023, By Sector of Origin
Figure 105: South Korea Export and Import Value & Volume, 2023-2030 ($)
Figure 106: India Wax Emulsion Market Value & Volume, 2023-2030 ($)
Figure 107: India GDP and Population, 2023-2030 ($)
Figure 108: India GDP – Composition of 2023, By Sector of Origin
Figure 109: India Export and Import Value & Volume, 2023-2030 ($)
Figure 110: Taiwan Wax Emulsion MarketTaiwan 3D Printing Market Value & Volume, 2023-2030 ($)
Figure 111: Taiwan GDP and Population, 2023-2030 ($)
Figure 112: Taiwan GDP – Composition of 2023, By Sector of Origin
Figure 113: Taiwan Export and Import Value & Volume, 2023-2030 ($)
Figure 114: Malaysia Wax Emulsion MarketMalaysia 3D Printing Market Value & Volume, 2023-2030 ($)
Figure 115: Malaysia GDP and Population, 2023-2030 ($)
Figure 116: Malaysia GDP – Composition of 2023, By Sector of Origin
Figure 117: Malaysia Export and Import Value & Volume, 2023-2030 ($)
Figure 118: Hong Kong Wax Emulsion MarketHong Kong 3D Printing Market Value & Volume, 2023-2030 ($)
Figure 119: Hong Kong GDP and Population, 2023-2030 ($)
Figure 120: Hong Kong GDP – Composition of 2023, By Sector of Origin
Figure 121: Hong Kong Export and Import Value & Volume, 2023-2030 ($)
Figure 122: Middle East & Africa Wax Emulsion MarketMiddle East & Africa 3D Printing Market Value & Volume, 2023-2030 ($)
Figure 123: Russia Wax Emulsion MarketRussia 3D Printing Market Value & Volume, 2023-2030 ($)
Figure 124: Russia GDP and Population, 2023-2030 ($)
Figure 125: Russia GDP – Composition of 2023, By Sector of Origin
Figure 126: Russia Export and Import Value & Volume, 2023-2030 ($)
Figure 127: Israel Wax Emulsion Market Value & Volume, 2023-2030 ($)
Figure 128: Israel GDP and Population, 2023-2030 ($)
Figure 129: Israel GDP – Composition of 2023, By Sector of Origin
Figure 130: Israel Export and Import Value & Volume, 2023-2030 ($)
Figure 131: Entropy Share, By Strategies, 2023-2030* (%)Wax Emulsion Market
Figure 132: Developments, 2023-2030*Wax Emulsion Market
Figure 133: Company 1 Wax Emulsion Market Net Revenue, By Years, 2023-2030* ($)
Figure 134: Company 1 Wax Emulsion Market Net Revenue Share, By Business segments, 2023 (%)
Figure 135: Company 1 Wax Emulsion Market Net Sales Share, By Geography, 2023 (%)
Figure 136: Company 2 Wax Emulsion Market Net Revenue, By Years, 2023-2030* ($)
Figure 137: Company 2 Wax Emulsion Market Net Revenue Share, By Business segments, 2023 (%)
Figure 138: Company 2 Wax Emulsion Market Net Sales Share, By Geography, 2023 (%)
Figure 139: Company 3Wax Emulsion Market Net Revenue, By Years, 2023-2030* ($)
Figure 140: Company 3Wax Emulsion Market Net Revenue Share, By Business segments, 2023 (%)
Figure 141: Company 3Wax Emulsion Market Net Sales Share, By Geography, 2023 (%)
Figure 142: Company 4 Wax Emulsion Market Net Revenue, By Years, 2023-2030* ($)
Figure 143: Company 4 Wax Emulsion Market Net Revenue Share, By Business segments, 2023 (%)
Figure 144: Company 4 Wax Emulsion Market Net Sales Share, By Geography, 2023 (%)
Figure 145: Company 5 Wax Emulsion Market Net Revenue, By Years, 2023-2030* ($)
Figure 146: Company 5 Wax Emulsion Market Net Revenue Share, By Business segments, 2023 (%)
Figure 147: Company 5 Wax Emulsion Market Net Sales Share, By Geography, 2023 (%)
Figure 148: Company 6 Wax Emulsion Market Net Revenue, By Years, 2023-2030* ($)
Figure 149: Company 6 Wax Emulsion Market Net Revenue Share, By Business segments, 2023 (%)
Figure 150: Company 6 Wax Emulsion Market Net Sales Share, By Geography, 2023 (%)
Figure 151: Company 7 Wax Emulsion Market Net Revenue, By Years, 2023-2030* ($)
Figure 152: Company 7 Wax Emulsion Market Net Revenue Share, By Business segments, 2023 (%)
Figure 153: Company 7 Wax Emulsion Market Net Sales Share, By Geography, 2023 (%)
Figure 154: Company 8 Wax Emulsion Market Net Revenue, By Years, 2023-2030* ($)
Figure 155: Company 8 Wax Emulsion Market Net Revenue Share, By Business segments, 2023 (%)
Figure 156: Company 8 Wax Emulsion Market Net Sales Share, By Geography, 2023 (%)
Figure 157: Company 9 Wax Emulsion Market Net Revenue, By Years, 2023-2030* ($)
Figure 158: Company 9 Wax Emulsion Market Net Revenue Share, By Business segments, 2023 (%)
Figure 159: Company 9 Wax Emulsion Market Net Sales Share, By Geography, 2023 (%)
Figure 160: Company 10 Wax Emulsion Market Net Revenue, By Years, 2023-2030* ($)
Figure 161: Company 10 Wax Emulsion Market Net Revenue Share, By Business segments, 2023 (%)
Figure 162: Company 10 Wax Emulsion Market Net Sales Share, By Geography, 2023 (%)
Figure 163: Company 11 Wax Emulsion Market Net Revenue, By Years, 2023-2030* ($)
Figure 164: Company 11 Wax Emulsion Market Net Revenue Share, By Business segments, 2023 (%)
Figure 165: Company 11 Wax Emulsion Market Net Sales Share, By Geography, 2023 (%)
Figure 166: Company 12 Wax Emulsion Market Net Revenue, By Years, 2023-2030* ($)
Figure 167: Company 12 Wax Emulsion Market Net Revenue Share, By Business segments, 2023 (%)
Figure 168: Company 12 Wax Emulsion Market Net Sales Share, By Geography, 2023 (%)
Figure 169: Company 13Wax Emulsion Market Net Revenue, By Years, 2023-2030* ($)
Figure 170: Company 13Wax Emulsion Market Net Revenue Share, By Business segments, 2023 (%)
Figure 171: Company 13Wax Emulsion Market Net Sales Share, By Geography, 2023 (%)
Figure 172: Company 14 Wax Emulsion Market Net Revenue, By Years, 2023-2030* ($)
Figure 173: Company 14 Wax Emulsion Market Net Revenue Share, By Business segments, 2023 (%)
Figure 174: Company 14 Wax Emulsion Market Net Sales Share, By Geography, 2023 (%)
Figure 175: Company 15 Wax Emulsion Market Net Revenue, By Years, 2023-2030* ($)
Figure 176: Company 15 Wax Emulsion Market Net Revenue Share, By Business segments, 2023 (%)
Figure 177: Company 15 Wax Emulsion Market Net Sales Share, By Geography, 2023 (%)