 Email
Email Print
Print


Radiation Hardened Electronic Devices and Components Market – By Product, By Voltage, By End-Use Industry, By Geography - Global Opportunity Analysis & Industry Forecast, 2023-2030
Radiation Hardened Electronic Devices and Components Market Overview:
Radiation Hardened Electronic Devices and Components Market size is estimated to reach $2.2 billion by 2030, growing at a CAGR of 4.2% during the forecast period 2023-2030. The increasing demand for Radiation Hardened Electronic Devices and Components owing to the rising surge in space, aeronautics and nuclear industries are expected to propel the growth of the Radiation Hardened Electronic Devices and Components Market.
Additionally, the expansion of space missions is creating substantial growth opportunities for the Radiation Hardened Electronic Devices and Components Market. According to Military and Aerospace FPGA and Applications (MAFA), The Radiation Hardened Electronics for Space Environments (RHESE) project expands the current state-of-the-art in radiation-hardened electronics to develop high performance devices robust enough to withstand the demanding radiation and thermal conditions encountered within the space and lunar environments.
Radiation Hardened Electronic Devices and Components Market - Report Coverage:
The “Radiation Hardened Electronic Devices and Components Market Report - Forecast (2023-2030)” by IndustryARC, covers an in-depth analysis of the following segments in the Radiation Hardened Electronic Devices and Components Market.
| Attribute | Segment |
|---|---|
|
By Product |
|
|
By Voltage |
|
|
By End-Use Industry |
|
|
By Geography |
|
COVID-19 / Ukraine Crisis - Impact Analysis:
-
The COVID-19 pandemic has brought about a range of challenges and disruptions to various industries. Supply chain disruptions, lockdowns, and restrictions on international trade have affected the production and distribution of these specialized components. However, the importance of certain applications, such as medical devices and critical infrastructure, led to sustained demand for radiation-hardened components in these sectors.
-
The Ukrainian crisis, characterized by geopolitical tensions and conflict, has implications for the radiation-hardened electronic devices and components market, particularly in the context of defense and national security. The crisis has led to increased scrutiny and potential re-evaluation of supply chains, especially for components critical to defense systems. The heightened focus on national security could result in increased demand for these components, especially those used in military and defense applications.
Key Takeaways:
-
Fastest Growth APAC Region
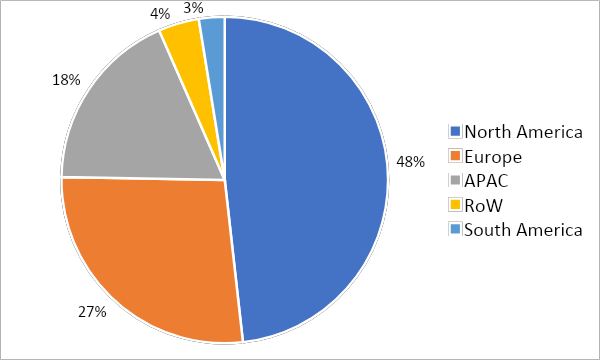
Geographically, in the global Radiation Hardened Electronic Devices and Components Market share, APAC is analyzed to grow with the highest CAGR of 5.9% during the forecast period. As China expands its presence in space exploration and satellite technology, the need for reliable and resilient electronic components capable of withstanding radiation exposure is poised to increase significantly. According to the China Aerospace Science and Technology Corporation (CASC) country's state-owned and private space industry operators are planning a total of more than 70 launches throughout 2023. This indicates a growing demand for Radiation Hardened Electronic Devices and Components in the country's burgeoning space industry.
-
Power GaN FET to Register the Fastest Growth
In the Radiation Hardened Electronic Devices and Components Market analysis, the Power GaN FET segment is estimated to grow with the highest CAGR of 5.6% during the forecast period, driven by their wider bandgap. Commercial satellite expansion and reconnaissance (ISR) activities are further bolstering the demand for radiation-resistant electronics. GaN power devices are considered more robust than hard rad MOSFETs when exposed to various forms of radiation, making them the ideal choice for power conversion applications in space. The electrical and thermal performance of GaN has also demonstrated superior operation in a space environment. In 2023, EPC Space introduced two new radiation-hardened GaN transistors for high-current switching in space- based applications.
-
Low Voltage is Leading the Market
According to the Radiation Hardened Electronic Devices and Components Market forecast, the Low Voltage segment held the largest market share of 55% in 2022. With a voltage capacity below 100V are crucial in applications where exposure to radiation is a significant concern, these specialized components are designed to withstand and operate in high- radiation environments, ensuring the reliability and longevity of electronic systems Low-voltage radiation-hardened electronic devices and components are essential for industries like aerospace, space and telecommunications. These specialized components are designed to withstand the harsh conditions of space or high-radiation environments, ensuring uninterrupted operations and protecting critical data.
-
Demand For Radiation-Hardened Electronics Components in Communication Satellites
Communication satellites operate in the harsh environment of outer space, where they are exposed to various forms of radiation, including solar radiation, cosmic rays, and high-energy particles. These radiations can cause damage to standard electronic components, leading to malfunctions or failures. Radiation-hardened components are designed to withstand these conditions, making them essential for satellite applications. Airbus has invested in Singapore based startup Zero Error Systems $7.5 Million for development of semiconductor solutions for space and power management applications. The semiconductor innovations are important support high processing power required, and reliability in extreme environments for Low Earth Orbit satellites, and deep space rovers and landers.
-
Increasing Government Initiatives to Expand the Semiconductor Industry
Intelligence and surveillance activities play a crucial role in various sectors, including defense, aerospace, and national security. Governments and militaries around the world invest heavily in intelligence and surveillance technologies to gather information, monitor activities, and ensure the safety and security of their nations. Additionally, the government of India authorized the Semicon India program in December 2022, with a total investment of $9.24 billion for the development of the country's semiconductor manufacturing ecosystem. The government is committed to developing the overall semiconductor ecosystem, which will fuel India's fast expanding electronics manufacturing and innovation ecosystem.
-
Electronics Components Shortage on The Global Space Industry Hamper Market Growth
The global space industry heavily relies on advanced electronic components, including radiation-hardened devices, for various space missions and satellite systems. These components are designed to withstand the harsh conditions of space, including radiation exposure, extreme temperatures, and vacuum environments. The shortage of electronic components has led to supply chain disruptions, delayed production, and increased costs for space industry players. Due to increased demand for consumer electronics, automotive electronics, and the rapid growth of emerging technologies like 5G and the Internet of Things (IoT). In 2021, a semiconductor shortage in the U.S. reduced the GDP by 1%, highlighting vulnerabilities in the supply chain. The U.S. is a key player in semiconductor manufacturing equipment and chip design, with a 39% market share globally.
Radiation Hardened Electronic Devices and Components Market Share (%) By Geography, 2023
For more details on this report - Request for Sample
Key Market Players:
Product/Service launches, approvals, patents and events, acquisitions, partnerships and collaborations are key strategies adopted by players in the Radiation Hardened Electronic Devices and Components Market. The top 10 companies in this industry are listed below:
-
BAE Systems Plc
-
Microchip Technology Inc.
-
STMicroelectronics N.V.
-
Honeywell International Inc.,
-
Texas Instruments Incorporated
-
Infineon Technologies AG
-
Renesas Electronics Corporation
-
Analog Devices, Inc.
-
Xilinx, Inc. (AMD)
-
TTM Technology
Scope of the Report:
| Report Metric | Details |
|---|---|
|
Base Year Considered |
2022 |
|
Forecast Period |
2022–2030 |
|
CAGR |
4.2% |
|
Market Size in 2030 |
$2.2 billion |
|
Segments Covered |
Product, Voltage, End-Use Industry and Geography |
|
Geographies Covered |
North America (USA, Canada, Mexico), South America (Brazil, Argentina, Chile, Colombia and Others), Europe (Germany, France, UK, Italy, Spain, Russia, Netherlands and Others), APAC (China, Japan, South Korea, India, Australia, Indonesia, Malaysia and Others), RoW (Middle East, Africa) |
|
Key Market Players |
|
For more Electronics Market reports, please click here
List of Tables
Table1 Radiation Hardened Electronic Devices and Components Market Overview 2023-2030
Table2 Radiation Hardened Electronic Devices and Components Market Leader Analysis 2023-2024 (US$)
Table3 Radiation Hardened Electronic Devices and Components MarketProduct Analysis 2023-2024 (US$)
Table4 Radiation Hardened Electronic Devices and Components MarketEnd User Analysis 2023-2024 (US$)
Table5 Radiation Hardened Electronic Devices and Components MarketPatent Analysis 2021-2023* (US$)
Table6 Radiation Hardened Electronic Devices and Components MarketFinancial Analysis 2023-2024 (US$)
Table7 Radiation Hardened Electronic Devices and Components Market Driver Analysis 2023-2024 (US$)
Table8 Radiation Hardened Electronic Devices and Components MarketChallenges Analysis 2023-2024 (US$)
Table9 Radiation Hardened Electronic Devices and Components MarketConstraint Analysis 2023-2024 (US$)
Table10 Radiation Hardened Electronic Devices and Components Market Supplier Bargaining Power Analysis 2023-2024 (US$)
Table11 Radiation Hardened Electronic Devices and Components Market Buyer Bargaining Power Analysis 2023-2024 (US$)
Table12 Radiation Hardened Electronic Devices and Components Market Threat of Substitutes Analysis 2023-2024 (US$)
Table13 Radiation Hardened Electronic Devices and Components Market Threat of New Entrants Analysis 2023-2024 (US$)
Table14 Radiation Hardened Electronic Devices and Components Market Degree of Competition Analysis 2023-2024 (US$)
Table15 Radiation Hardened Electronic Devices and Components MarketValue Chain Analysis 2023-2024 (US$)
Table16 Radiation Hardened Electronic Devices and Components MarketPricing Analysis 2023-2030 (US$)
Table17 Radiation Hardened Electronic Devices and Components MarketOpportunities Analysis 2023-2030 (US$)
Table18 Radiation Hardened Electronic Devices and Components MarketProduct Life Cycle Analysis 2023-2030 (US$)
Table19 Radiation Hardened Electronic Devices and Components MarketSupplier Analysis 2023-2024 (US$)
Table20 Radiation Hardened Electronic Devices and Components MarketDistributor Analysis 2023-2024 (US$)
Table21 Radiation Hardened Electronic Devices and Components Market Trend Analysis 2023-2024 (US$)
Table22 Radiation Hardened Electronic Devices and Components Market Size 2023 (US$)
Table23 Radiation Hardened Electronic Devices and Components Market Forecast Analysis 2023-2030 (US$)
Table24 Radiation Hardened Electronic Devices and Components Market Sales Forecast Analysis 2023-2030 (Units)
Table25 Radiation Hardened Electronic Devices and Components Market, Revenue & Volume,By Products, 2023-2030 ($)
Table26 Radiation Hardened Electronic Devices and Components MarketBy Products, Revenue & Volume,By Analog And Mixed Signal/ Digital Electronic Devices, 2023-2030 ($)
Table27 Radiation Hardened Electronic Devices and Components MarketBy Products, Revenue & Volume,By Discrete Semiconductors, 2023-2030 ($)
Table28 Radiation Hardened Electronic Devices and Components MarketBy Products, Revenue & Volume,By Optoelectronics, 2023-2030 ($)
Table29 Radiation Hardened Electronic Devices and Components MarketBy Products, Revenue & Volume,By Power Management, 2023-2030 ($)
Table30 Radiation Hardened Electronic Devices and Components MarketBy Products, Revenue & Volume,By Sensors, 2023-2030 ($)
Table31 Radiation Hardened Electronic Devices and Components Market, Revenue & Volume,By Product-Type, 2023-2030 ($)
Table32 Radiation Hardened Electronic Devices and Components MarketBy Product-Type, Revenue & Volume,By Custom-Made, 2023-2030 ($)
Table33 Radiation Hardened Electronic Devices and Components MarketBy Product-Type, Revenue & Volume,By Commercial-Off-The-Shelf (Cots), 2023-2030 ($)
Table34 Radiation Hardened Electronic Devices and Components Market, Revenue & Volume,By Materials, 2023-2030 ($)
Table35 Radiation Hardened Electronic Devices and Components MarketBy Materials, Revenue & Volume,By Silicon, 2023-2030 ($)
Table36 Radiation Hardened Electronic Devices and Components MarketBy Materials, Revenue & Volume,By Silicon Carbide, 2023-2030 ($)
Table37 Radiation Hardened Electronic Devices and Components MarketBy Materials, Revenue & Volume,By Gallium Nitride, 2023-2030 ($)
Table38 Radiation Hardened Electronic Devices and Components MarketBy Materials, Revenue & Volume,By Hydrogenated Amorphous Silicon, 2023-2030 ($)
Table39 Radiation Hardened Electronic Devices and Components MarketBy Materials, Revenue & Volume,By Application 5, 2023-2030 ($)
Table40 Radiation Hardened Electronic Devices and Components Market, Revenue & Volume,By Industry Verticals, 2023-2030 ($)
Table41 Radiation Hardened Electronic Devices and Components MarketBy Industry Verticals, Revenue & Volume,By Aerospace, 2023-2030 ($)
Table42 Radiation Hardened Electronic Devices and Components MarketBy Industry Verticals, Revenue & Volume,By Military, 2023-2030 ($)
Table43 Radiation Hardened Electronic Devices and Components MarketBy Industry Verticals, Revenue & Volume,By Space, 2023-2030 ($)
Table44 Radiation Hardened Electronic Devices and Components MarketBy Industry Verticals, Revenue & Volume,By Nuclear, 2023-2030 ($)
Table45 Radiation Hardened Electronic Devices and Components MarketBy Industry Verticals, Revenue & Volume,By Medical, 2023-2030 ($)
Table46 North America Radiation Hardened Electronic Devices and Components Market, Revenue & Volume,By Products, 2023-2030 ($)
Table47 North America Radiation Hardened Electronic Devices and Components Market, Revenue & Volume,By Product-Type, 2023-2030 ($)
Table48 North America Radiation Hardened Electronic Devices and Components Market, Revenue & Volume,By Technology, 2023-2030 ($)
Table49 North America Radiation Hardened Electronic Devices and Components Market, Revenue & Volume,By Materials, 2023-2030 ($)
Table50 North America Radiation Hardened Electronic Devices and Components Market, Revenue & Volume,By Industry Verticals, 2023-2030 ($)
Table51 South america Radiation Hardened Electronic Devices and Components Market, Revenue & Volume,By Products, 2023-2030 ($)
Table52 South america Radiation Hardened Electronic Devices and Components Market, Revenue & Volume,By Product-Type, 2023-2030 ($)
Table53 South america Radiation Hardened Electronic Devices and Components Market, Revenue & Volume,By Technology, 2023-2030 ($)
Table54 South america Radiation Hardened Electronic Devices and Components Market, Revenue & Volume,By Materials, 2023-2030 ($)
Table55 South america Radiation Hardened Electronic Devices and Components Market, Revenue & Volume,By Industry Verticals, 2023-2030 ($)
Table56 Europe Radiation Hardened Electronic Devices and Components Market, Revenue & Volume,By Products, 2023-2030 ($)
Table57 Europe Radiation Hardened Electronic Devices and Components Market, Revenue & Volume,By Product-Type, 2023-2030 ($)
Table58 Europe Radiation Hardened Electronic Devices and Components Market, Revenue & Volume,By Technology, 2023-2030 ($)
Table59 Europe Radiation Hardened Electronic Devices and Components Market, Revenue & Volume,By Materials, 2023-2030 ($)
Table60 Europe Radiation Hardened Electronic Devices and Components Market, Revenue & Volume,By Industry Verticals, 2023-2030 ($)
Table61 APAC Radiation Hardened Electronic Devices and Components Market, Revenue & Volume,By Products, 2023-2030 ($)
Table62 APAC Radiation Hardened Electronic Devices and Components Market, Revenue & Volume,By Product-Type, 2023-2030 ($)
Table63 APAC Radiation Hardened Electronic Devices and Components Market, Revenue & Volume,By Technology, 2023-2030 ($)
Table64 APAC Radiation Hardened Electronic Devices and Components Market, Revenue & Volume,By Materials, 2023-2030 ($)
Table65 APAC Radiation Hardened Electronic Devices and Components Market, Revenue & Volume,By Industry Verticals, 2023-2030 ($)
Table66 Middle East & Africa Radiation Hardened Electronic Devices and Components Market, Revenue & Volume,By Products, 2023-2030 ($)
Table67 Middle East & Africa Radiation Hardened Electronic Devices and Components Market, Revenue & Volume,By Product-Type, 2023-2030 ($)
Table68 Middle East & Africa Radiation Hardened Electronic Devices and Components Market, Revenue & Volume,By Technology, 2023-2030 ($)
Table69 Middle East & Africa Radiation Hardened Electronic Devices and Components Market, Revenue & Volume,By Materials, 2023-2030 ($)
Table70 Middle East & Africa Radiation Hardened Electronic Devices and Components Market, Revenue & Volume,By Industry Verticals, 2023-2030 ($)
Table71 Russia Radiation Hardened Electronic Devices and Components Market, Revenue & Volume,By Products, 2023-2030 ($)
Table72 Russia Radiation Hardened Electronic Devices and Components Market, Revenue & Volume,By Product-Type, 2023-2030 ($)
Table73 Russia Radiation Hardened Electronic Devices and Components Market, Revenue & Volume,By Technology, 2023-2030 ($)
Table74 Russia Radiation Hardened Electronic Devices and Components Market, Revenue & Volume,By Materials, 2023-2030 ($)
Table75 Russia Radiation Hardened Electronic Devices and Components Market, Revenue & Volume,By Industry Verticals, 2023-2030 ($)
Table76 Israel Radiation Hardened Electronic Devices and Components Market, Revenue & Volume,By Products, 2023-2030 ($)
Table77 Israel Radiation Hardened Electronic Devices and Components Market, Revenue & Volume,By Product-Type, 2023-2030 ($)
Table78 Israel Radiation Hardened Electronic Devices and Components Market, Revenue & Volume,By Technology, 2023-2030 ($)
Table79 Israel Radiation Hardened Electronic Devices and Components Market, Revenue & Volume,By Materials, 2023-2030 ($)
Table80 Israel Radiation Hardened Electronic Devices and Components Market, Revenue & Volume,By Industry Verticals, 2023-2030 ($)
Table81 Top Companies 2023 (US$)Radiation Hardened Electronic Devices and Components Market, Revenue & Volume,,
Table82 Product Launch 2023-2024Radiation Hardened Electronic Devices and Components Market, Revenue & Volume,,
List of Figures
Figure 1 Overview of Radiation Hardened Electronic Devices and Components Market 2023-2030
Figure 2 Market Share Analysis for Radiation Hardened Electronic Devices and Components Market 2023 (US$)
Figure 3 Product Comparison in Radiation Hardened Electronic Devices and Components Market 2023-2024 (US$)
Figure 4 End User Profile for Radiation Hardened Electronic Devices and Components Market 2023-2024 (US$)
Figure 5 Patent Application and Grant in Radiation Hardened Electronic Devices and Components Market 2021-2023* (US$)
Figure 6 Top 5 Companies Financial Analysis in Radiation Hardened Electronic Devices and Components Market 2023-2024 (US$)
Figure 7 Market Entry Strategy in Radiation Hardened Electronic Devices and Components Market 2023-2024
Figure 8 Ecosystem Analysis in Radiation Hardened Electronic Devices and Components Market2023
Figure 9 Average Selling Price in Radiation Hardened Electronic Devices and Components Market 2023-2030
Figure 10 Top Opportunites in Radiation Hardened Electronic Devices and Components Market 2023-2024
Figure 11 Market Life Cycle Analysis in Radiation Hardened Electronic Devices and Components Market
Figure 12 GlobalBy ProductsRadiation Hardened Electronic Devices and Components Market Revenue, 2023-2030 ($)
Figure 13 GlobalBy Product-TypeRadiation Hardened Electronic Devices and Components Market Revenue, 2023-2030 ($)
Figure 14 GlobalBy MaterialsRadiation Hardened Electronic Devices and Components Market Revenue, 2023-2030 ($)
Figure 15 GlobalBy Industry VerticalsRadiation Hardened Electronic Devices and Components Market Revenue, 2023-2030 ($)
Figure 16 Global Radiation Hardened Electronic Devices and Components Market - By Geography
Figure 17 Global Radiation Hardened Electronic Devices and Components Market Value & Volume, By Geography, 2023-2030 ($)
Figure 18 Global Radiation Hardened Electronic Devices and Components Market CAGR, By Geography, 2023-2030 (%)
Figure 19 North America Radiation Hardened Electronic Devices and Components Market Value & Volume, 2023-2030 ($)
Figure 20 US Radiation Hardened Electronic Devices and Components Market Value & Volume, 2023-2030 ($)
Figure 21 US GDP and Population, 2023-2024 ($)
Figure 22 US GDP – Composition of 2023, By Sector of Origin
Figure 23 US Export and Import Value & Volume, 2023-2024 ($)
Figure 24 Canada Radiation Hardened Electronic Devices and Components Market Value & Volume, 2023-2030 ($)
Figure 25 Canada GDP and Population, 2023-2024 ($)
Figure 26 Canada GDP – Composition of 2023, By Sector of Origin
Figure 27 Canada Export and Import Value & Volume, 2023-2024 ($)
Figure 28 Mexico Radiation Hardened Electronic Devices and Components Market Value & Volume, 2023-2030 ($)
Figure 29 Mexico GDP and Population, 2023-2024 ($)
Figure 30 Mexico GDP – Composition of 2023, By Sector of Origin
Figure 31 Mexico Export and Import Value & Volume, 2023-2024 ($)
Figure 32 South America Radiation Hardened Electronic Devices and Components MarketSouth America 3D Printing Market Value & Volume, 2023-2030 ($)
Figure 33 Brazil Radiation Hardened Electronic Devices and Components Market Value & Volume, 2023-2030 ($)
Figure 34 Brazil GDP and Population, 2023-2024 ($)
Figure 35 Brazil GDP – Composition of 2023, By Sector of Origin
Figure 36 Brazil Export and Import Value & Volume, 2023-2024 ($)
Figure 37 Venezuela Radiation Hardened Electronic Devices and Components Market Value & Volume, 2023-2030 ($)
Figure 38 Venezuela GDP and Population, 2023-2024 ($)
Figure 39 Venezuela GDP – Composition of 2023, By Sector of Origin
Figure 40 Venezuela Export and Import Value & Volume, 2023-2024 ($)
Figure 41 Argentina Radiation Hardened Electronic Devices and Components Market Value & Volume, 2023-2030 ($)
Figure 42 Argentina GDP and Population, 2023-2024 ($)
Figure 43 Argentina GDP – Composition of 2023, By Sector of Origin
Figure 44 Argentina Export and Import Value & Volume, 2023-2024 ($)
Figure 45 Ecuador Radiation Hardened Electronic Devices and Components Market Value & Volume, 2023-2030 ($)
Figure 46 Ecuador GDP and Population, 2023-2024 ($)
Figure 47 Ecuador GDP – Composition of 2023, By Sector of Origin
Figure 48 Ecuador Export and Import Value & Volume, 2023-2024 ($)
Figure 49 Peru Radiation Hardened Electronic Devices and Components Market Value & Volume, 2023-2030 ($)
Figure 50 Peru GDP and Population, 2023-2024 ($)
Figure 51 Peru GDP – Composition of 2023, By Sector of Origin
Figure 52 Peru Export and Import Value & Volume, 2023-2024 ($)
Figure 53 Colombia Radiation Hardened Electronic Devices and Components Market Value & Volume, 2023-2030 ($)
Figure 54 Colombia GDP and Population, 2023-2024 ($)
Figure 55 Colombia GDP – Composition of 2023, By Sector of Origin
Figure 56 Colombia Export and Import Value & Volume, 2023-2024 ($)
Figure 57 Costa Rica Radiation Hardened Electronic Devices and Components MarketCosta Rica 3D Printing Market Value & Volume, 2023-2030 ($)
Figure 58 Costa Rica GDP and Population, 2023-2024 ($)
Figure 59 Costa Rica GDP – Composition of 2023, By Sector of Origin
Figure 60 Costa Rica Export and Import Value & Volume, 2023-2024 ($)
Figure 61 Europe Radiation Hardened Electronic Devices and Components Market Value & Volume, 2023-2030 ($)
Figure 62 U.K Radiation Hardened Electronic Devices and Components Market Value & Volume, 2023-2030 ($)
Figure 63 U.K GDP and Population, 2023-2024 ($)
Figure 64 U.K GDP – Composition of 2023, By Sector of Origin
Figure 65 U.K Export and Import Value & Volume, 2023-2024 ($)
Figure 66 Germany Radiation Hardened Electronic Devices and Components Market Value & Volume, 2023-2030 ($)
Figure 67 Germany GDP and Population, 2023-2024 ($)
Figure 68 Germany GDP – Composition of 2023, By Sector of Origin
Figure 69 Germany Export and Import Value & Volume, 2023-2024 ($)
Figure 70 Italy Radiation Hardened Electronic Devices and Components Market Value & Volume, 2023-2030 ($)
Figure 71 Italy GDP and Population, 2023-2024 ($)
Figure 72 Italy GDP – Composition of 2023, By Sector of Origin
Figure 73 Italy Export and Import Value & Volume, 2023-2024 ($)
Figure 74 France Radiation Hardened Electronic Devices and Components Market Value & Volume, 2023-2030 ($)
Figure 75 France GDP and Population, 2023-2024 ($)
Figure 76 France GDP – Composition of 2023, By Sector of Origin
Figure 77 France Export and Import Value & Volume, 2023-2024 ($)
Figure 78 Netherlands Radiation Hardened Electronic Devices and Components Market Value & Volume, 2023-2030 ($)
Figure 79 Netherlands GDP and Population, 2023-2024 ($)
Figure 80 Netherlands GDP – Composition of 2023, By Sector of Origin
Figure 81 Netherlands Export and Import Value & Volume, 2023-2024 ($)
Figure 82 Belgium Radiation Hardened Electronic Devices and Components Market Value & Volume, 2023-2030 ($)
Figure 83 Belgium GDP and Population, 2023-2024 ($)
Figure 84 Belgium GDP – Composition of 2023, By Sector of Origin
Figure 85 Belgium Export and Import Value & Volume, 2023-2024 ($)
Figure 86 Spain Radiation Hardened Electronic Devices and Components Market Value & Volume, 2023-2030 ($)
Figure 87 Spain GDP and Population, 2023-2024 ($)
Figure 88 Spain GDP – Composition of 2023, By Sector of Origin
Figure 89 Spain Export and Import Value & Volume, 2023-2024 ($)
Figure 90 Denmark Radiation Hardened Electronic Devices and Components Market Value & Volume, 2023-2030 ($)
Figure 91 Denmark GDP and Population, 2023-2024 ($)
Figure 92 Denmark GDP – Composition of 2023, By Sector of Origin
Figure 93 Denmark Export and Import Value & Volume, 2023-2024 ($)
Figure 94 APAC Radiation Hardened Electronic Devices and Components Market Value & Volume, 2023-2030 ($)
Figure 95 China Radiation Hardened Electronic Devices and Components MarketValue & Volume, 2023-2030
Figure 96 China GDP and Population, 2023-2024 ($)
Figure 97 China GDP – Composition of 2023, By Sector of Origin
Figure 98 China Export and Import Value & Volume, 2023-2024 ($)Radiation Hardened Electronic Devices and Components MarketChina Export and Import Value & Volume, 2023-2024 ($)
Figure 99 Australia Radiation Hardened Electronic Devices and Components Market Value & Volume, 2023-2030 ($)
Figure 100 Australia GDP and Population, 2023-2024 ($)
Figure 101 Australia GDP – Composition of 2023, By Sector of Origin
Figure 102 Australia Export and Import Value & Volume, 2023-2024 ($)
Figure 103 South Korea Radiation Hardened Electronic Devices and Components Market Value & Volume, 2023-2030 ($)
Figure 104 South Korea GDP and Population, 2023-2024 ($)
Figure 105 South Korea GDP – Composition of 2023, By Sector of Origin
Figure 106 South Korea Export and Import Value & Volume, 2023-2024 ($)
Figure 107 India Radiation Hardened Electronic Devices and Components Market Value & Volume, 2023-2030 ($)
Figure 108 India GDP and Population, 2023-2024 ($)
Figure 109 India GDP – Composition of 2023, By Sector of Origin
Figure 110 India Export and Import Value & Volume, 2023-2024 ($)
Figure 111 Taiwan Radiation Hardened Electronic Devices and Components MarketTaiwan 3D Printing Market Value & Volume, 2023-2030 ($)
Figure 112 Taiwan GDP and Population, 2023-2024 ($)
Figure 113 Taiwan GDP – Composition of 2023, By Sector of Origin
Figure 114 Taiwan Export and Import Value & Volume, 2023-2024 ($)
Figure 115 Malaysia Radiation Hardened Electronic Devices and Components MarketMalaysia 3D Printing Market Value & Volume, 2023-2030 ($)
Figure 116 Malaysia GDP and Population, 2023-2024 ($)
Figure 117 Malaysia GDP – Composition of 2023, By Sector of Origin
Figure 118 Malaysia Export and Import Value & Volume, 2023-2024 ($)
Figure 119 Hong Kong Radiation Hardened Electronic Devices and Components MarketHong Kong 3D Printing Market Value & Volume, 2023-2030 ($)
Figure 120 Hong Kong GDP and Population, 2023-2024 ($)
Figure 121 Hong Kong GDP – Composition of 2023, By Sector of Origin
Figure 122 Hong Kong Export and Import Value & Volume, 2023-2024 ($)
Figure 123 Middle East & Africa Radiation Hardened Electronic Devices and Components MarketMiddle East & Africa 3D Printing Market Value & Volume, 2023-2030 ($)
Figure 124 Russia Radiation Hardened Electronic Devices and Components MarketRussia 3D Printing Market Value & Volume, 2023-2030 ($)
Figure 125 Russia GDP and Population, 2023-2024 ($)
Figure 126 Russia GDP – Composition of 2023, By Sector of Origin
Figure 127 Russia Export and Import Value & Volume, 2023-2024 ($)
Figure 128 Israel Radiation Hardened Electronic Devices and Components Market Value & Volume, 2023-2030 ($)
Figure 129 Israel GDP and Population, 2023-2024 ($)
Figure 130 Israel GDP – Composition of 2023, By Sector of Origin
Figure 131 Israel Export and Import Value & Volume, 2023-2024 ($)
Figure 132 Entropy Share, By Strategies, 2023-2024* (%)Radiation Hardened Electronic Devices and Components Market
Figure 133 Developments, 2023-2024*Radiation Hardened Electronic Devices and Components Market
Figure 134 Company 1 Radiation Hardened Electronic Devices and Components Market Net Revenue, By Years, 2023-2024* ($)
Figure 135 Company 1 Radiation Hardened Electronic Devices and Components Market Net Revenue Share, By Business segments, 2023 (%)
Figure 136 Company 1 Radiation Hardened Electronic Devices and Components Market Net Sales Share, By Geography, 2023 (%)
Figure 137 Company 2 Radiation Hardened Electronic Devices and Components Market Net Revenue, By Years, 2023-2024* ($)
Figure 138 Company 2 Radiation Hardened Electronic Devices and Components Market Net Revenue Share, By Business segments, 2023 (%)
Figure 139 Company 2 Radiation Hardened Electronic Devices and Components Market Net Sales Share, By Geography, 2023 (%)
Figure 140 Company 3Radiation Hardened Electronic Devices and Components Market Net Revenue, By Years, 2023-2024* ($)
Figure 141 Company 3Radiation Hardened Electronic Devices and Components Market Net Revenue Share, By Business segments, 2023 (%)
Figure 142 Company 3Radiation Hardened Electronic Devices and Components Market Net Sales Share, By Geography, 2023 (%)
Figure 143 Company 4 Radiation Hardened Electronic Devices and Components Market Net Revenue, By Years, 2023-2024* ($)
Figure 144 Company 4 Radiation Hardened Electronic Devices and Components Market Net Revenue Share, By Business segments, 2023 (%)
Figure 145 Company 4 Radiation Hardened Electronic Devices and Components Market Net Sales Share, By Geography, 2023 (%)
Figure 146 Company 5 Radiation Hardened Electronic Devices and Components Market Net Revenue, By Years, 2023-2024* ($)
Figure 147 Company 5 Radiation Hardened Electronic Devices and Components Market Net Revenue Share, By Business segments, 2023 (%)
Figure 148 Company 5 Radiation Hardened Electronic Devices and Components Market Net Sales Share, By Geography, 2023 (%)
Figure 149 Company 6 Radiation Hardened Electronic Devices and Components Market Net Revenue, By Years, 2023-2024* ($)
Figure 150 Company 6 Radiation Hardened Electronic Devices and Components Market Net Revenue Share, By Business segments, 2023 (%)
Figure 151 Company 6 Radiation Hardened Electronic Devices and Components Market Net Sales Share, By Geography, 2023 (%)
Figure 152 Company 7 Radiation Hardened Electronic Devices and Components Market Net Revenue, By Years, 2023-2024* ($)
Figure 153 Company 7 Radiation Hardened Electronic Devices and Components Market Net Revenue Share, By Business segments, 2023 (%)
Figure 154 Company 7 Radiation Hardened Electronic Devices and Components Market Net Sales Share, By Geography, 2023 (%)
Figure 155 Company 8 Radiation Hardened Electronic Devices and Components Market Net Revenue, By Years, 2023-2024* ($)
Figure 156 Company 8 Radiation Hardened Electronic Devices and Components Market Net Revenue Share, By Business segments, 2023 (%)
Figure 157 Company 8 Radiation Hardened Electronic Devices and Components Market Net Sales Share, By Geography, 2023 (%)
Figure 158 Company 9 Radiation Hardened Electronic Devices and Components Market Net Revenue, By Years, 2023-2024* ($)
Figure 159 Company 9 Radiation Hardened Electronic Devices and Components Market Net Revenue Share, By Business segments, 2023 (%)
Figure 160 Company 9 Radiation Hardened Electronic Devices and Components Market Net Sales Share, By Geography, 2023 (%)
Figure 161 Company 10 Radiation Hardened Electronic Devices and Components Market Net Revenue, By Years, 2023-2024* ($)
Figure 162 Company 10 Radiation Hardened Electronic Devices and Components Market Net Revenue Share, By Business segments, 2023 (%)
Figure 163 Company 10 Radiation Hardened Electronic Devices and Components Market Net Sales Share, By Geography, 2023 (%)
Figure 164 Company 11 Radiation Hardened Electronic Devices and Components Market Net Revenue, By Years, 2023-2024* ($)
Figure 165 Company 11 Radiation Hardened Electronic Devices and Components Market Net Revenue Share, By Business segments, 2023 (%)
Figure 166 Company 11 Radiation Hardened Electronic Devices and Components Market Net Sales Share, By Geography, 2023 (%)
Figure 167 Company 12 Radiation Hardened Electronic Devices and Components Market Net Revenue, By Years, 2023-2024* ($)
Figure 168 Company 12 Radiation Hardened Electronic Devices and Components Market Net Revenue Share, By Business segments, 2023 (%)
Figure 169 Company 12 Radiation Hardened Electronic Devices and Components Market Net Sales Share, By Geography, 2023 (%)
Figure 170 Company 13Radiation Hardened Electronic Devices and Components Market Net Revenue, By Years, 2023-2024* ($)
Figure 171 Company 13Radiation Hardened Electronic Devices and Components Market Net Revenue Share, By Business segments, 2023 (%)
Figure 172 Company 13Radiation Hardened Electronic Devices and Components Market Net Sales Share, By Geography, 2023 (%)
Figure 173 Company 14 Radiation Hardened Electronic Devices and Components Market Net Revenue, By Years, 2023-2024* ($)
Figure 174 Company 14 Radiation Hardened Electronic Devices and Components Market Net Revenue Share, By Business segments, 2023 (%)
Figure 175 Company 14 Radiation Hardened Electronic Devices and Components Market Net Sales Share, By Geography, 2023 (%)
Figure 176 Company 15 Radiation Hardened Electronic Devices and Components Market Net Revenue, By Years, 2023-2024* ($)
Figure 177 Company 15 Radiation Hardened Electronic Devices and Components Market Net Revenue Share, By Business segments, 2023 (%)
Figure 178 Company 15 Radiation Hardened Electronic Devices and Components Market Net Sales Share, By Geography, 2023 (%)