 Email
Email Print
Print


USA Professional Hair Care Market - By Gender, By Products, By Type, By Distribution Channels - Opportunity Analysis & Industry Forecast, 2024-2030
USA Professional Hair Care Market Overview:
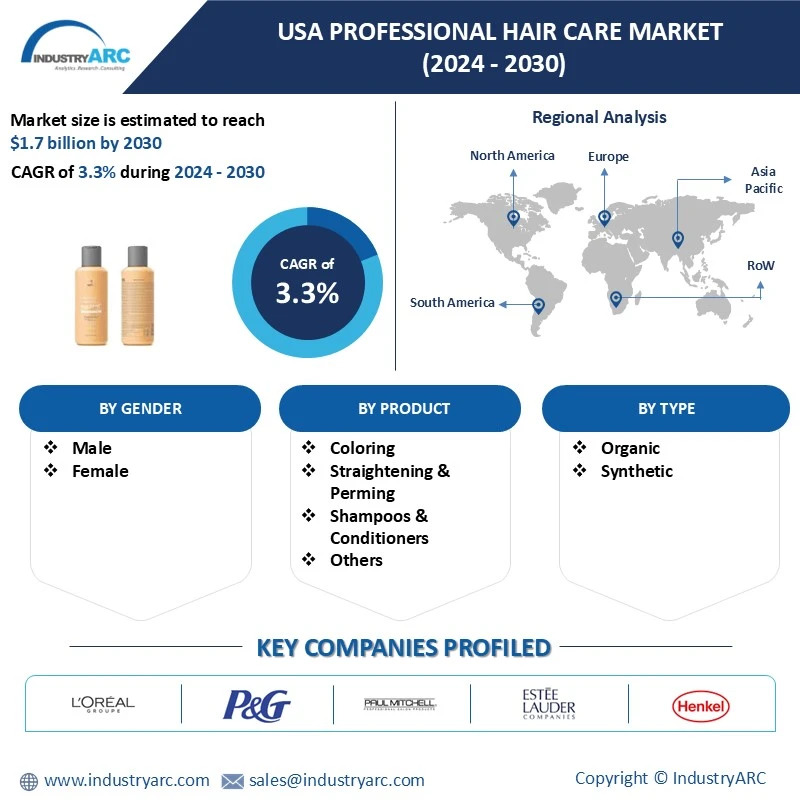
USA Professional Hair Care Market size is estimated to reach $1.7 billion by 2030, growing at a CAGR of 3.3% during the forecast period 2024-2030. Professional hair care products include shampoos, conditioners, hair masks, coloring products and hair styling products, including hair serums, mousses, hairsprays, and more for all kinds of hair types and textures. These products are applied to manage hair problems such as hair loss, dandruff, frizzy hair, itchy or dry scalp, split ends and more. Increased consumer spending on hair care products, rising demand for chemical-free hair care products, growing demand for luxury products, and the increasing influence of social media are the major factors that are set to drive the growth of the USA Professional Hair Care market during the forecast period 2024-2030.
The US professional hair care market is the largest in the world, driven by a number of factors including a strong preference for high-quality hair care products, a large and established salon industry, and a growing trend of consumers purchasing professional-grade hair care products for at-home use. The US professional hair care market is expected to be fueled by trends such as growing interest in sustainability. Younger generation specifically, are more interest in eco-friendly, vegan and cruelty-free formulations and prefer that their products meet the same. As a result, brands are focusing on sustainable packaging.
Market Snapshot:
USA Professional Hair Care Market - Report Coverage:
The “USA Professional Hair Care Market Report - Forecast (2024-2030)” by IndustryARC, covers an in-depth analysis of the following segments in the USA Professional Hair Care Market.
| Attribute | Segment |
|---|---|
|
By Gender |
|
|
By Product |
· Straightening & Perming
|
|
By Type |
|
|
By Distribution Channels |
|
COVID-19 / Ukraine Crisis - Impact Analysis:
- The pandemic affected the USA Professional Hair Care Market. The fear of contracting the virus and limited salon services for most of 2020 and 2021 led to many consumers adopting home salon routines. Since in-person shopping was restricted, online sales of hair care products likely saw a rise. Hair loss and the loss of its texture and strength have been attributed to the long-term effects of COVID-19. A study by the US Center for Disease Control and Prevention (CDC) found that 58.3% of people who tested positive reported hair loss as one of the symptoms. This has boosted the professional hair care market.
- The Russia- Ukraine war indirectly affected the professional hair care market due to inflation. U.S. experienced a sharp decline in retail volume demand in beauty and personal care, due to an inflation rate not seen in a decade. This made consumers much more cautious about their spending, as their disposable incomes reduced due to higher interest rates implemented by the central bank and rising unemployment.
Key Takeaways:
-
Hair Coloring to Grow the Fastest
Coloring is the main service in the hair salons which drives the revenues and the footfalls. Coloring trends are vibrant owing to cultural and ethnic diversity. Low-cost, low maintenance simple cut and color service that needs less maintenance and reduced styling care is in demand owing to a busy lifestyle. Demi permanent colors are in demand by young urban women who try to avoid harmful chemicals like Paraphenyldiamine (PPD) found in permanent dyes. Clients prefer standalone root coloring the least as they are unable to make frequent visit to the hair salon. Fashionable crowd, younger demographics and teens opt for offbeat hair colors. Bright, strong, whole-head or high contrast color in red, blonde or even navy blue and violet shades are popular for dark hair. The 20-30 year age group and the teens are going in for the multi-chromatic color look with multiple shades of highlights on hair.
-
Rise in number of professional beauty Salons
America has the biggest salon chains in the world like Regis and Fantastic Sams. Transition from mid tier salon chains and independent salons towards suites, mobile hair dressers and booth rentals is taking place in wake of demand for personalized services. Renters use social media and technological tools like mobile apps to connect with the customers. This has increased the reach of the hair salons and the frequency of the footfalls in hair salons. Booth rental salons strongly drive sales at open-line Sally stores. Booth rentals also propel full-service sales at Beauty Systems Group (BSG)/Cosmoprof, Salon Centric and all other distributor stores. About 50% of the salons run on booth rental, salon suite and retail store model. The transition from bigger and older salon chains like Regis is occurring owing to strong demand for more personalized services. This has built pressure on bigger chains like Fantastic Sams and mid tier chains like Toni & Guy, J.C. Penney and Ratner. Ratner Co. to come out with salon plazas with a booth rental model with more than 1000 renters.
-
Rising awareness about the type of ingredients used in hair care products
Brand-conscious shoppers have become picky for the use of salons & brands. Brand-conscious shoppers have become picky for the use of salons & brands. Salons can't decide to set up cubicles at a flea market in their society since professionals don’t allow their products to be sold at flea markets. This becomes a major challenge for the low, medium & new upcoming brands to stand up in the market. Hence proper advertisement and market sales should be increased to make the brand conscious shoppers aware of their brands.
-
Growing focus on hair texture
Consumers are demanding a wider range of products that cater to their specific hair textures, from straight to curly, thick to thin. Social media and online platforms have played a significant role in raising awareness about different hair textures and the unique needs associated with each, more over celebrities and influencers with diverse hair textures are helping to normalize and celebrate different hair types. Brands are developing products specifically designed for various hair textures, addressing the unique challenges and needs of each, they are offering products tailored to specific hair textures, such as those for curly, wavy, or coily hair. Brands and influencers are providing education and resources on how to care for different hair textures.
USA Professional Hair Care Market: Market Share (%) by Product, 2023

For more details on this report - Request for Sample
Key Market Players:
Product/Service launches, approvals, patents and events, acquisitions, partnerships and collaborations are key strategies adopted by players in the USA Professional Hair Care Market. The top 10 companies in the USA Professional Hair Care market are:
- L'Oreal Group
- Procter & Gamble
- Paul Mitchell
- Estee Lauder Companies Inc.
- Henkel AG & Co. KGaA
- Revlon Inc
- Yves Rocher
- Unilever
- Coty Inc.
- Wella
Scope of Report:
| Report Metric | Details |
|---|---|
|
Market size available for years |
2023–2030 |
|
Base year considered |
2023 |
|
Forecast period |
2024–2030 |
|
Forecast units |
Value (USD) |
|
Segments covered |
Gender, Product, Type and Distribution Channels |
|
Companies covered |
Key 10 players covered include 1. L'Oreal Group 2. Procter & Gamble 3. Paul Mitchell 4. Estee Lauder Companies Inc. 5. Henkel AG & Co. KGaA 6. Revlon Inc 7. Yves Rocher 8. Unilever 9. Coty Inc. 10. Wella
|
For more Consumer Products and Services Market reports, please click here
List of Tables
Table 1: U.S.A. Professional Hair Care Market Overview 2023-2030
Table 2: U.S.A. Professional Hair Care Market Leader Analysis 2023-2024 (US$)
Table 3: U.S.A. Professional Hair Care Market Product Analysis 2023-2024 (US$)
Table 4: U.S.A. Professional Hair Care Market End User Analysis 2023-2024 (US$)
Table 5: U.S.A. Professional Hair Care Market Patent Analysis 2021-2023* (US$)
Table 6: U.S.A. Professional Hair Care Market Financial Analysis 2023-2024 (US$)
Table 7: U.S.A. Professional Hair Care Market Driver Analysis 2023-2024 (US$)
Table 8: U.S.A. Professional Hair Care Market Challenges Analysis 2023-2024 (US$)
Table 9: U.S.A. Professional Hair Care Market Constraint Analysis 2023-2024 (US$)
Table 10: U.S.A. Professional Hair Care Market Supplier Bargaining Power Analysis 2023-2024 (US$)
Table 11: U.S.A. Professional Hair Care Market Buyer Bargaining Power Analysis 2023-2024 (US$)
Table 12: U.S.A. Professional Hair Care Market Threat of Substitutes Analysis 2023-2024 (US$)
Table 13: U.S.A. Professional Hair Care Market Threat of New Entrants Analysis 2023-2024 (US$)
Table 14: U.S.A. Professional Hair Care Market Degree of Competition Analysis 2023-2024 (US$)
Table 15: U.S.A. Professional Hair Care Market Value Chain Analysis 2023-2024 (US$)
Table 16: U.S.A. Professional Hair Care Market Pricing Analysis 2023-2030 (US$)
Table 17: U.S.A. Professional Hair Care Market Opportunities Analysis 2023-2030 (US$)
Table 18: U.S.A. Professional Hair Care Market Product Life Cycle Analysis 2023-2030 (US$)
Table 19: U.S.A. Professional Hair Care Market Supplier Analysis 2023-2024 (US$)
Table 20: U.S.A. Professional Hair Care Market Distributor Analysis 2023-2024 (US$)
Table 21: U.S.A. Professional Hair Care Market Trend Analysis 2023-2024 (US$)
Table 22: U.S.A. Professional Hair Care Market Size 2023 (US$)
Table 23: U.S.A. Professional Hair Care Market Forecast Analysis 2023-2030 (US$)
Table 24: U.S.A. Professional Hair Care Market Sales Forecast Analysis 2023-2030 (Units)
Table 25: U.S.A. Professional Hair Care Market, Revenue & Volume, By Category, 2023-2030 ($)
Table 26: U.S.A. Professional Hair Care Market By Category, Revenue & Volume, By Organized, 2023-2030 ($)
Table 27: U.S.A. Professional Hair Care Market By Category, Revenue & Volume, By Unorganized, 2023-2030 ($)
Table 28: U.S.A. Professional Hair Care Market By Price, Revenue & Volume, By Price Analysis for Hair Care Services, 2023-2030 ($)
Table 29: U.S.A. Professional Hair Care Market, Revenue & Volume, By Location, 2023-2030 ($)
Table 30: U.S.A. Professional Hair Care Market By Location, Revenue & Volume, By Distribution by Location (% Share), 2023-2030 ($)
Table 31: North America U.S.A. Professional Hair Care Market, Revenue & Volume, By Category, 2023-2030 ($)
Table 32: North America U.S.A. Professional Hair Care Market, Revenue & Volume, By Price, 2023-2030 ($)
Table 33: North America U.S.A. Professional Hair Care Market, Revenue & Volume, By Location, 2023-2030 ($)
Table 34: South america U.S.A. Professional Hair Care Market, Revenue & Volume, By Category, 2023-2030 ($)
Table 35: South america U.S.A. Professional Hair Care Market, Revenue & Volume, By Price, 2023-2030 ($)
Table 36: South america U.S.A. Professional Hair Care Market, Revenue & Volume, By Location, 2023-2030 ($)
Table 37: Europe U.S.A. Professional Hair Care Market, Revenue & Volume, By Category, 2023-2030 ($)
Table 38: Europe U.S.A. Professional Hair Care Market, Revenue & Volume, By Price, 2023-2030 ($)
Table 39: Europe U.S.A. Professional Hair Care Market, Revenue & Volume, By Location, 2023-2030 ($)
Table 40: APAC U.S.A. Professional Hair Care Market, Revenue & Volume, By Category, 2023-2030 ($)
Table 41: APAC U.S.A. Professional Hair Care Market, Revenue & Volume, By Price, 2023-2030 ($)
Table 42: APAC U.S.A. Professional Hair Care Market, Revenue & Volume, By Location, 2023-2030 ($)
Table 43: Middle East & Africa U.S.A. Professional Hair Care Market, Revenue & Volume, By Category, 2023-2030 ($)
Table 44: Middle East & Africa U.S.A. Professional Hair Care Market, Revenue & Volume, By Price, 2023-2030 ($)
Table 45: Middle East & Africa U.S.A. Professional Hair Care Market, Revenue & Volume, By Location, 2023-2030 ($)
Table 46: Russia U.S.A. Professional Hair Care Market, Revenue & Volume, By Category, 2023-2030 ($)
Table 47: Russia U.S.A. Professional Hair Care Market, Revenue & Volume, By Price, 2023-2030 ($)
Table 48: Russia U.S.A. Professional Hair Care Market, Revenue & Volume, By Location, 2023-2030 ($)
Table 49: Israel U.S.A. Professional Hair Care Market, Revenue & Volume, By Category, 2023-2030 ($)
Table 50: Israel U.S.A. Professional Hair Care Market, Revenue & Volume, By Price, 2023-2030 ($)
Table 51: Israel U.S.A. Professional Hair Care Market, Revenue & Volume, By Location, 2023-2030 ($)
Table 52: Top Companies 2023 (US$)U.S.A. Professional Hair Care Market, Revenue & Volume
Table 53: Product Launch 2023-2024U.S.A. Professional Hair Care Market, Revenue & Volume
Table 54: Mergers & Acquistions 2023-2024U.S.A. Professional Hair Care Market, Revenue & Volume
List of Figures
Figure 1: Overview of U.S.A. Professional Hair Care Market 2023-2030
Figure 2: Market Share Analysis for U.S.A. Professional Hair Care Market 2023 (US$)
Figure 3: Product Comparison in U.S.A. Professional Hair Care Market 2023-2024 (US$)
Figure 4: End User Profile for U.S.A. Professional Hair Care Market 2023-2024 (US$)
Figure 5: Patent Application and Grant in U.S.A. Professional Hair Care Market 2021-2023* (US$)
Figure 6: Top 5 Companies Financial Analysis in U.S.A. Professional Hair Care Market 2023-2024 (US$)
Figure 7: Market Entry Strategy in U.S.A. Professional Hair Care Market 2023-2024
Figure 8: Ecosystem Analysis in U.S.A. Professional Hair Care Market 2023
Figure 9: Average Selling Price in U.S.A. Professional Hair Care Market 2023-2030
Figure 10: Top Opportunites in U.S.A. Professional Hair Care Market 2023-2024
Figure 11: Market Life Cycle Analysis in U.S.A. Professional Hair Care Market
Figure 12: GlobalBy CategoryU.S.A. Professional Hair Care Market Revenue, 2023-2030 ($)
Figure 13: GlobalBy PriceU.S.A. Professional Hair Care Market Revenue, 2023-2030 ($)
Figure 14: GlobalBy LocationU.S.A. Professional Hair Care Market Revenue, 2023-2030 ($)
Figure 15: Global U.S.A. Professional Hair Care Market - By U.S.A
Figure 16: Global U.S.A. Professional Hair Care Market Value & Volume, By U.S.A, 2023-2030 ($)
Figure 17: Global U.S.A. Professional Hair Care Market CAGR, By U.S.A, 2023-2030 (%)
Figure 18: North America U.S.A. Professional Hair Care Market Value & Volume, 2023-2030 ($)
Figure 19: US U.S.A. Professional Hair Care Market Value & Volume, 2023-2030 ($)
Figure 20: US GDP and Population, 2023-2024 ($)
Figure 21: US GDP – Composition of 2023, By Sector of Origin
Figure 22: US Export and Import Value & Volume, 2023-2024 ($)
Figure 23: Canada U.S.A. Professional Hair Care Market Value & Volume, 2023-2030 ($)
Figure 24: Canada GDP and Population, 2023-2024 ($)
Figure 25: Canada GDP – Composition of 2023, By Sector of Origin
Figure 26: Canada Export and Import Value & Volume, 2023-2024 ($)
Figure 27: Mexico U.S.A. Professional Hair Care Market Value & Volume, 2023-2030 ($)
Figure 28: Mexico GDP and Population, 2023-2024 ($)
Figure 29: Mexico GDP – Composition of 2023, By Sector of Origin
Figure 30: Mexico Export and Import Value & Volume, 2023-2024 ($)
Figure 31: South America U.S.A. Professional Hair Care Market Value & Volume, 2023-2030 ($)
Figure 32: Brazil U.S.A. Professional Hair Care Market Value & Volume, 2023-2030 ($)
Figure 33: Brazil GDP and Population, 2023-2024 ($)
Figure 34: Brazil GDP – Composition of 2023, By Sector of Origin
Figure 35: Brazil Export and Import Value & Volume, 2023-2024 ($)
Figure 36: Venezuela U.S.A. Professional Hair Care Market Value & Volume, 2023-2030 ($)
Figure 37: Venezuela GDP and Population, 2023-2024 ($)
Figure 38: Venezuela GDP – Composition of 2023, By Sector of Origin
Figure 39: Venezuela Export and Import Value & Volume, 2023-2024 ($)
Figure 40: Argentina U.S.A. Professional Hair Care Market Value & Volume, 2023-2030 ($)
Figure 41: Argentina GDP and Population, 2023-2024 ($)
Figure 42: Argentina GDP – Composition of 2023, By Sector of Origin
Figure 43: Argentina Export and Import Value & Volume, 2023-2024 ($)
Figure 44: Ecuador U.S.A. Professional Hair Care Market Value & Volume, 2023-2030 ($)
Figure 45: Ecuador GDP and Population, 2023-2024 ($)
Figure 46: Ecuador GDP – Composition of 2023, By Sector of Origin
Figure 47: Ecuador Export and Import Value & Volume, 2023-2024 ($)
Figure 48: Peru U.S.A. Professional Hair Care Market Value & Volume, 2023-2030 ($)
Figure 49: Peru GDP and Population, 2023-2024 ($)
Figure 50: Peru GDP – Composition of 2023, By Sector of Origin
Figure 51: Peru Export and Import Value & Volume, 2023-2024 ($)
Figure 52: Colombia U.S.A. Professional Hair Care Market Value & Volume, 2023-2030 ($)
Figure 53: Colombia GDP and Population, 2023-2024 ($)
Figure 54: Colombia GDP – Composition of 2023, By Sector of Origin
Figure 55: Colombia Export and Import Value & Volume, 2023-2024 ($)
Figure 56: Costa Rica U.S.A. Professional Hair Care Market Value & Volume, 2023-2030 ($)
Figure 57: Costa Rica GDP and Population, 2023-2024 ($)
Figure 58: Costa Rica GDP – Composition of 2023, By Sector of Origin
Figure 59: Costa Rica Export and Import Value & Volume, 2023-2024 ($)
Figure 60: Europe U.S.A. Professional Hair Care Market Value & Volume, 2023-2030 ($)
Figure 61: U.K U.S.A. Professional Hair Care Market Value & Volume, 2023-2030 ($)
Figure 62: U.K GDP and Population, 2023-2024 ($)
Figure 63: U.K GDP – Composition of 2023, By Sector of Origin
Figure 64: U.K Export and Import Value & Volume, 2023-2024 ($)
Figure 65: Germany U.S.A. Professional Hair Care Market Value & Volume, 2023-2030 ($)
Figure 66: Germany GDP and Population, 2023-2024 ($)
Figure 67: Germany GDP – Composition of 2023, By Sector of Origin
Figure 68: Germany Export and Import Value & Volume, 2023-2024 ($)
Figure 69: Italy U.S.A. Professional Hair Care Market Value & Volume, 2023-2030 ($)
Figure 70: Italy GDP and Population, 2023-2024 ($)
Figure 71: Italy GDP – Composition of 2023, By Sector of Origin
Figure 72: Italy Export and Import Value & Volume, 2023-2024 ($)
Figure 73: France U.S.A. Professional Hair Care Market Value & Volume, 2023-2030 ($)
Figure 74: France GDP and Population, 2023-2024 ($)
Figure 75: France GDP – Composition of 2023, By Sector of Origin
Figure 76: France Export and Import Value & Volume, 2023-2024 ($)
Figure 77: Netherlands U.S.A. Professional Hair Care Market Value & Volume, 2023-2030 ($)
Figure 78: Netherlands GDP and Population, 2023-2024 ($)
Figure 79: Netherlands GDP – Composition of 2023, By Sector of Origin
Figure 80: Netherlands Export and Import Value & Volume, 2023-2024 ($)
Figure 81: Belgium U.S.A. Professional Hair Care Market Value & Volume, 2023-2030 ($)
Figure 82: Belgium GDP and Population, 2023-2024 ($)
Figure 83: Belgium GDP – Composition of 2023, By Sector of Origin
Figure 84: Belgium Export and Import Value & Volume, 2023-2024 ($)
Figure 85: Spain U.S.A. Professional Hair Care Market Value & Volume, 2023-2030 ($)
Figure 86: Spain GDP and Population, 2023-2024 ($)
Figure 87: Spain GDP – Composition of 2023, By Sector of Origin
Figure 88: Spain Export and Import Value & Volume, 2023-2024 ($)
Figure 89: Denmark U.S.A. Professional Hair Care Market Value & Volume, 2023-2030 ($)
Figure 90: Denmark GDP and Population, 2023-2024 ($)
Figure 91: Denmark GDP – Composition of 2023, By Sector of Origin
Figure 92: Denmark Export and Import Value & Volume, 2023-2024 ($)
Figure 93: APAC U.S.A. Professional Hair Care Market Value & Volume, 2023-2030 ($)
Figure 94: China U.S.A. Professional Hair Care Market Value & Volume, 2023-2030
Figure 95: China GDP and Population, 2023-2024 ($)
Figure 96: China GDP – Composition of 2023, By Sector of Origin
Figure 97: China Export and Import Value & Volume, 2023-2024 ($)U.S.A. Professional Hair Care Market China Export and Import Value & Volume, 2023-2024 ($)
Figure 98: Australia U.S.A. Professional Hair Care Market Value & Volume, 2023-2030 ($)
Figure 99: Australia GDP and Population, 2023-2024 ($)
Figure 100: Australia GDP – Composition of 2023, By Sector of Origin
Figure 101: Australia Export and Import Value & Volume, 2023-2024 ($)
Figure 102: South Korea U.S.A. Professional Hair Care Market Value & Volume, 2023-2030 ($)
Figure 103: South Korea GDP and Population, 2023-2024 ($)
Figure 104: South Korea GDP – Composition of 2023, By Sector of Origin
Figure 105: South Korea Export and Import Value & Volume, 2023-2024 ($)
Figure 106: India U.S.A. Professional Hair Care Market Value & Volume, 2023-2030 ($)
Figure 107: India GDP and Population, 2023-2024 ($)
Figure 108: India GDP – Composition of 2023, By Sector of Origin
Figure 109: India Export and Import Value & Volume, 2023-2024 ($)
Figure 110: Taiwan U.S.A. Professional Hair Care Market Value & Volume, 2023-2030 ($)
Figure 111: Taiwan GDP and Population, 2023-2024 ($)
Figure 112: Taiwan GDP – Composition of 2023, By Sector of Origin
Figure 113: Taiwan Export and Import Value & Volume, 2023-2024 ($)
Figure 114: Malaysia U.S.A. Professional Hair Care Market Value & Volume, 2023-2030 ($)
Figure 115: Malaysia GDP and Population, 2023-2024 ($)
Figure 116: Malaysia GDP – Composition of 2023, By Sector of Origin
Figure 117: Malaysia Export and Import Value & Volume, 2023-2024 ($)
Figure 118: Hong Kong U.S.A. Professional Hair Care Market Value & Volume, 2023-2030 ($)
Figure 119: Hong Kong GDP and Population, 2023-2024 ($)
Figure 120: Hong Kong GDP – Composition of 2023, By Sector of Origin
Figure 121: Hong Kong Export and Import Value & Volume, 2023-2024 ($)
Figure 122: Middle East & Africa U.S.A. Professional Hair Care Market Middle East & Africa 3D Printing Market Value & Volume, 2023-2030 ($)
Figure 123: Russia U.S.A. Professional Hair Care Market Value & Volume, 2023-2030 ($)
Figure 124: Russia GDP and Population, 2023-2024 ($)
Figure 125: Russia GDP – Composition of 2023, By Sector of Origin
Figure 126: Russia Export and Import Value & Volume, 2023-2024 ($)
Figure 127: Israel U.S.A. Professional Hair Care Market Value & Volume, 2023-2030 ($)
Figure 128: Israel GDP and Population, 2023-2024 ($)
Figure 129: Israel GDP – Composition of 2023, By Sector of Origin
Figure 130: Israel Export and Import Value & Volume, 2023-2024 ($)
Figure 131: Entropy Share, By Strategies, 2023-2024* (%)U.S.A. Professional Hair Care Market
Figure 132: Developments, 2023-2024*U.S.A. Professional Hair Care Market
Figure 133: Company 1 U.S.A. Professional Hair Care Market Net Revenue, By Years, 2023-2024* ($)
Figure 134: Company 1 U.S.A. Professional Hair Care Market Net Revenue Share, By Business segments, 2023 (%)
Figure 135: Company 1 U.S.A. Professional Hair Care Market Net Sales Share, By U.S.A, 2023 (%)
Figure 136: Company 2 U.S.A. Professional Hair Care Market Net Revenue, By Years, 2023-2024* ($)
Figure 137: Company 2 U.S.A. Professional Hair Care Market Net Revenue Share, By Business segments, 2023 (%)
Figure 138: Company 2 U.S.A. Professional Hair Care Market Net Sales Share, By U.S.A, 2023 (%)
Figure 139: Company 3 U.S.A. Professional Hair Care Market Net Revenue, By Years, 2023-2024* ($)
Figure 140: Company 3 U.S.A. Professional Hair Care Market Net Revenue Share, By Business segments, 2023 (%)
Figure 141: Company 3 U.S.A. Professional Hair Care Market Net Sales Share, By U.S.A, 2023 (%)
Figure 142: Company 4 U.S.A. Professional Hair Care Market Net Revenue, By Years, 2023-2024* ($)
Figure 143: Company 4 U.S.A. Professional Hair Care Market Net Revenue Share, By Business segments, 2023 (%)
Figure 144: Company 4 U.S.A. Professional Hair Care Market Net Sales Share, By U.S.A, 2023 (%)
Figure 145: Company 5 U.S.A. Professional Hair Care Market Net Revenue, By Years, 2023-2024* ($)
Figure 146: Company 5 U.S.A. Professional Hair Care Market Net Revenue Share, By Business segments, 2023 (%)
Figure 147: Company 5 U.S.A. Professional Hair Care Market Net Sales Share, By U.S.A, 2023 (%)
Figure 148: Company 6 U.S.A. Professional Hair Care Market Net Revenue, By Years, 2023-2024* ($)
Figure 149: Company 6 U.S.A. Professional Hair Care Market Net Revenue Share, By Business segments, 2023 (%)
Figure 150: Company 6 U.S.A. Professional Hair Care Market Net Sales Share, By U.S.A, 2023 (%)
Figure 151: Company 7 U.S.A. Professional Hair Care Market Net Revenue, By Years, 2023-2024* ($)
Figure 152: Company 7 U.S.A. Professional Hair Care Market Net Revenue Share, By Business segments, 2023 (%)
Figure 153: Company 7 U.S.A. Professional Hair Care Market Net Sales Share, By U.S.A, 2023 (%)
Figure 154: Company 8 U.S.A. Professional Hair Care Market Net Revenue, By Years, 2023-2024* ($)
Figure 155: Company 8 U.S.A. Professional Hair Care Market Net Revenue Share, By Business segments, 2023 (%)
Figure 156: Company 8 U.S.A. Professional Hair Care Market Net Sales Share, By U.S.A, 2023 (%)
Figure 157: Company 9 U.S.A. Professional Hair Care Market Net Revenue, By Years, 2023-2024* ($)
Figure 158: Company 9 U.S.A. Professional Hair Care Market Net Revenue Share, By Business segments, 2023 (%)
Figure 159: Company 9 U.S.A. Professional Hair Care Market Net Sales Share, By U.S.A, 2023 (%)
Figure 160: Company 10 U.S.A. Professional Hair Care Market Net Revenue, By Years, 2023-2024* ($)
Figure 161: Company 10 U.S.A. Professional Hair Care Market Net Revenue Share, By Business segments, 2023 (%)
Figure 162: Company 10 U.S.A. Professional Hair Care Market Net Sales Share, By U.S.A, 2023 (%)
Figure 163: Company 11 U.S.A. Professional Hair Care Market Net Revenue, By Years, 2023-2024* ($)
Figure 164: Company 11 U.S.A. Professional Hair Care Market Net Revenue Share, By Business segments, 2023 (%)
Figure 165: Company 11 U.S.A. Professional Hair Care Market Net Sales Share, By U.S.A, 2023 (%)
Figure 166: Company 12 U.S.A. Professional Hair Care Market Net Revenue, By Years, 2023-2024* ($)
Figure 167: Company 12 U.S.A. Professional Hair Care Market Net Revenue Share, By Business segments, 2023 (%)
Figure 168: Company 12 U.S.A. Professional Hair Care Market Net Sales Share, By U.S.A, 2023 (%)
Figure 169: Company 13 U.S.A. Professional Hair Care Market Net Revenue, By Years, 2023-2024* ($)
Figure 170: Company 13 U.S.A. Professional Hair Care Market Net Revenue Share, By Business segments, 2023 (%)
Figure 171: Company 13 U.S.A. Professional Hair Care Market Net Sales Share, By U.S.A, 2023 (%)
Figure 172: Company 14 U.S.A. Professional Hair Care Market Net Revenue, By Years, 2023-2024* ($)
Figure 173: Company 14 U.S.A. Professional Hair Care Market Net Revenue Share, By Business segments, 2023 (%)
Figure 174: Company 14 U.S.A. Professional Hair Care Market Net Sales Share, By U.S.A, 2023 (%)
Figure 175: Company 15 U.S.A. Professional Hair Care Market Net Revenue, By Years, 2023-2024* ($)
Figure 176: Company 15 U.S.A. Professional Hair Care Market Net Revenue Share, By Business segments, 2023 (%)
Figure 177: Company 15 U.S.A. Professional Hair Care Market Net Sales Share, By U.S.A, 2023 (%)
The USA Professional Hair Care Market is forecast to grow at 3.3% during the forecast period 2024-2030
Global USA Professional Hair Care Market size is projected to reach US$1.7 billion by 2030
L\\\\\\\'Oreal Group, Procter & Gamble, Paul Mitchell, Estee Lauder Companies Inc., Henkel AG & Co. KGaA and others.
Increasing customer awareness regarding hair protection, high internet penetration leading to increased social media usage and influencers, as well as high hair color trends are the major trends.
Increased consumer demand for professional hair care products, rising demand for chemical-free hair care products, growing demand for luxury products, and the increasing influence of social media are driving the USA Professional Hair Care Market growth.