 Email
Email Print
Print


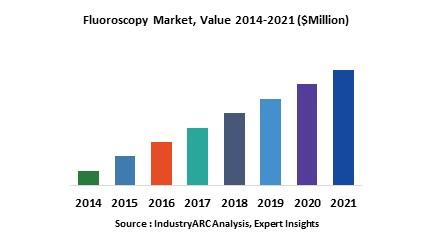
Fluoroscopy Market Overview
- Fluoroscopy Market, By Procedure Type: Cardiovascular Interventions, Biopsy, Orthopaedic surgeries and Others
- Fluoroscopy Market, By Equipment Type: Fixed c-arm positioners, Mobile c-arm positioners, Under table x-ray tube and Over the table x-ray tube
- Fluoroscopy Market, By End-Use: Hospitals, Diagnostic Centers and Clinics
- This report has been further segmented into major regions, which includes detailed analysis of each region such as: North America, Europe, Asia-Pacific (APAC), and Rest of the World (RoW) covering all the major country level markets in each of the region. The major countries considered under the Asia-Pacific region are India, China, South Korea and Japan. The major countries considered under the European region are Germany, U.K., France, Italy, Spain and Russia. The major countries considered under the North American region are United States, Canada and Mexico.
Key Market Players:
The Top 5 companies in the Fluoroscopy Market are:
- Canon
- Hitachi
- Siemens
- GE
- Philips
For more Lifesciences and Healthcare Market reports, please click here
List of Tables:
Table1: Fluoroscopy Market Overview 2023-2030
Table2: Fluoroscopy Market Leader Analysis 2023-2030 (US$)
Table3: Fluoroscopy Market Product Analysis 2023-2030 (US$)
Table4: Fluoroscopy Market End User Analysis 2023-2030 (US$)
Table5: Fluoroscopy Market Patent Analysis 2013-2023* (US$)
Table6: Fluoroscopy Market Financial Analysis 2023-2030 (US$)
Table7: Fluoroscopy Market Driver Analysis 2023-2030 (US$)
Table8: Fluoroscopy Market Challenges Analysis 2023-2030 (US$)
Table9: Fluoroscopy Market Constraint Analysis 2023-2030 (US$)
Table10: Fluoroscopy Market Supplier Bargaining Power Analysis 2023-2030 (US$)
Table11: Fluoroscopy Market Buyer Bargaining Power Analysis 2023-2030 (US$)
Table12: Fluoroscopy Market Threat of Substitutes Analysis 2023-2030 (US$)
Table13: Fluoroscopy Market Threat of New Entrants Analysis 2023-2030 (US$)
Table14: Fluoroscopy Market Degree of Competition Analysis 2023-2030 (US$)
Table15: Fluoroscopy Market Value Chain Analysis 2023-2030 (US$)
Table16: Fluoroscopy Market Pricing Analysis 2023-2030 (US$)
Table17: Fluoroscopy Market Opportunities Analysis 2023-2030 (US$)
Table18: Fluoroscopy Market Product Life Cycle Analysis 2023-2030 (US$)
Table19: Fluoroscopy Market Supplier Analysis 2023-2030 (US$)
Table20: Fluoroscopy Market Distributor Analysis 2023-2030 (US$)
Table21: Fluoroscopy Market Trend Analysis 2023-2030 (US$)
Table22: Fluoroscopy Market Size 2023 (US$)
Table23: Fluoroscopy Market Forecast Analysis 2023-2030 (US$)
Table24: Fluoroscopy Market Sales Forecast Analysis 2023-2030 (Units)
Table25: Fluoroscopy Market, Revenue & Volume, By Procedure Type, 2023-2030 ($)
Table26: Fluoroscopy Market By Procedure Type, Revenue & Volume, By Cardiovascular Interventions, 2023-2030 ($)
Table27: Fluoroscopy Market By Procedure Type, Revenue & Volume, By Biopsy, 2023-2030 ($)
Table28: Fluoroscopy Market By Procedure Type, Revenue & Volume, By Orthopaedic surgeries, 2023-2030 ($)
Table29: Fluoroscopy Market, Revenue & Volume, By Equipment Type, 2023-2030 ($)
Table30: Fluoroscopy Market By Equipment Type, Revenue & Volume, By Fixed c-arm positioners, 2023-2030 ($)
Table31: Fluoroscopy Market By Equipment Type, Revenue & Volume, By Mobile c-arm positioners, 2023-2030 ($)
Table32: Fluoroscopy Market By Equipment Type, Revenue & Volume, By Under table x-ray tube, 2023-2030 ($)
Table33: Fluoroscopy Market By Equipment Type, Revenue & Volume, By Over the table x-ray tube, 2023-2030 ($)
Table34: Fluoroscopy Market, Revenue & Volume, By End Use, 2023-2030 ($)
Table35: Fluoroscopy Market By End Use, Revenue & Volume, By Hospitals, 2023-2030 ($)
Table36: Fluoroscopy Market By End Use, Revenue & Volume, By Diagnostic Centers, 2023-2030 ($)
Table37: Fluoroscopy Market By End Use, Revenue & Volume, By Clinics, 2023-2030 ($)
Table38: North America Fluoroscopy Market, Revenue & Volume, By Procedure Type, 2023-2030 ($)
Table39: North America Fluoroscopy Market, Revenue & Volume, By Equipment Type, 2023-2030 ($)
Table40: North America Fluoroscopy Market, Revenue & Volume, By End Use, 2023-2030 ($)
Table41: South america Fluoroscopy Market, Revenue & Volume, By Procedure Type, 2023-2030 ($)
Table42: South america Fluoroscopy Market, Revenue & Volume, By Equipment Type, 2023-2030 ($)
Table43: South america Fluoroscopy Market, Revenue & Volume, By End Use, 2023-2030 ($)
Table44: Europe Fluoroscopy Market, Revenue & Volume, By Procedure Type, 2023-2030 ($)
Table45: Europe Fluoroscopy Market, Revenue & Volume, By Equipment Type, 2023-2030 ($)
Table46: Europe Fluoroscopy Market, Revenue & Volume, By End Use, 2023-2030 ($)
Table47: APAC Fluoroscopy Market, Revenue & Volume, By Procedure Type, 2023-2030 ($)
Table48: APAC Fluoroscopy Market, Revenue & Volume, By Equipment Type, 2023-2030 ($)
Table49: APAC Fluoroscopy Market, Revenue & Volume, By End Use, 2023-2030 ($)
Table50: Middle East & Africa Fluoroscopy Market, Revenue & Volume, By Procedure Type, 2023-2030 ($)
Table51: Middle East & Africa Fluoroscopy Market, Revenue & Volume, By Equipment Type, 2023-2030 ($)
Table52: Middle East & Africa Fluoroscopy Market, Revenue & Volume, By End Use, 2023-2030 ($)
Table53: Russia Fluoroscopy Market, Revenue & Volume, By Procedure Type, 2023-2030 ($)
Table54: Russia Fluoroscopy Market, Revenue & Volume, By Equipment Type, 2023-2030 ($)
Table55: Russia Fluoroscopy Market, Revenue & Volume, By End Use, 2023-2030 ($)
Table56: Israel Fluoroscopy Market, Revenue & Volume, By Procedure Type, 2023-2030 ($)
Table57: Israel Fluoroscopy Market, Revenue & Volume, By Equipment Type, 2023-2030 ($)
Table58: Israel Fluoroscopy Market, Revenue & Volume, By End Use, 2023-2030 ($)
Table59: Top Companies 2023 (US$)Fluoroscopy Market, Revenue & Volume
Table60: Product Launch 2023-2030Fluoroscopy Market, Revenue & Volume
Table61: Mergers & Acquistions 2023-2030Fluoroscopy Market, Revenue & Volume
List of Figures:
Figure 1: Overview of Fluoroscopy Market 2023-2030
Figure 2: Market Share Analysis for Fluoroscopy Market 2023 (US$)
Figure 3: Product Comparison in Fluoroscopy Market 2023-2030 (US$)
Figure 4: End User Profile for Fluoroscopy Market 2023-2030 (US$)
Figure 5: Patent Application and Grant in Fluoroscopy Market 2013-2023* (US$)
Figure 6: Top 5 Companies Financial Analysis in Fluoroscopy Market 2023-2030 (US$)
Figure 7: Market Entry Strategy in Fluoroscopy Market 2023-2030
Figure 8: Ecosystem Analysis in Fluoroscopy Market 2023
Figure 9: Average Selling Price in Fluoroscopy Market 2023-2030
Figure 10: Top Opportunites in Fluoroscopy Market 2023-2030
Figure 11: Market Life Cycle Analysis in Fluoroscopy Market
Figure 12: GlobalBy Procedure TypeFluoroscopy Market Revenue, 2023-2030 ($)
Figure 13: GlobalBy Equipment TypeFluoroscopy Market Revenue, 2023-2030 ($)
Figure 14: GlobalBy End UseFluoroscopy Market Revenue, 2023-2030 ($)
Figure 15: Global Fluoroscopy Market - By Geography
Figure 16: Global Fluoroscopy Market Value & Volume, By Geography, 2023-2030 ($)
Figure 17: Global Fluoroscopy Market CAGR, By Geography, 2023-2030 (%)
Figure 18: North America Fluoroscopy Market Value & Volume, 2023-2030 ($)
Figure 19: US Fluoroscopy Market Value & Volume, 2023-2030 ($)
Figure 20: US GDP and Population, 2023-2030 ($)
Figure 21: US GDP – Composition of 2023, By Sector of Origin
Figure 22: US Export and Import Value & Volume, 2023-2030 ($)
Figure 23: Canada Fluoroscopy Market Value & Volume, 2023-2030 ($)
Figure 24: Canada GDP and Population, 2023-2030 ($)
Figure 25: Canada GDP – Composition of 2023, By Sector of Origin
Figure 26: Canada Export and Import Value & Volume, 2023-2030 ($)
Figure 27: Mexico Fluoroscopy Market Value & Volume, 2023-2030 ($)
Figure 28: Mexico GDP and Population, 2023-2030 ($)
Figure 29: Mexico GDP – Composition of 2023, By Sector of Origin
Figure 30: Mexico Export and Import Value & Volume, 2023-2030 ($)
Figure 31: South America Fluoroscopy Market Value & Volume, 2023-2030 ($)
Figure 32: Brazil Fluoroscopy Market Value & Volume, 2023-2030 ($)
Figure 33: Brazil GDP and Population, 2023-2030 ($)
Figure 34: Brazil GDP – Composition of 2023, By Sector of Origin
Figure 35: Brazil Export and Import Value & Volume, 2023-2030 ($)
Figure 36: Venezuela Fluoroscopy Market Value & Volume, 2023-2030 ($)
Figure 37: Venezuela GDP and Population, 2023-2030 ($)
Figure 38: Venezuela GDP – Composition of 2023, By Sector of Origin
Figure 39: Venezuela Export and Import Value & Volume, 2023-2030 ($)
Figure 40: Argentina Fluoroscopy Market Value & Volume, 2023-2030 ($)
Figure 41: Argentina GDP and Population, 2023-2030 ($)
Figure 42: Argentina GDP – Composition of 2023, By Sector of Origin
Figure 43: Argentina Export and Import Value & Volume, 2023-2030 ($)
Figure 44: Ecuador Fluoroscopy Market Value & Volume, 2023-2030 ($)
Figure 45: Ecuador GDP and Population, 2023-2030 ($)
Figure 46: Ecuador GDP – Composition of 2023, By Sector of Origin
Figure 47: Ecuador Export and Import Value & Volume, 2023-2030 ($)
Figure 48: Peru Fluoroscopy Market Value & Volume, 2023-2030 ($)
Figure 49: Peru GDP and Population, 2023-2030 ($)
Figure 50: Peru GDP – Composition of 2023, By Sector of Origin
Figure 51: Peru Export and Import Value & Volume, 2023-2030 ($)
Figure 52: Colombia Fluoroscopy Market Value & Volume, 2023-2030 ($)
Figure 53: Colombia GDP and Population, 2023-2030 ($)
Figure 54: Colombia GDP – Composition of 2023, By Sector of Origin
Figure 55: Colombia Export and Import Value & Volume, 2023-2030 ($)
Figure 56: Costa Rica Fluoroscopy Market Value & Volume, 2023-2030 ($)
Figure 57: Costa Rica GDP and Population, 2023-2030 ($)
Figure 58: Costa Rica GDP – Composition of 2023, By Sector of Origin
Figure 59: Costa Rica Export and Import Value & Volume, 2023-2030 ($)
Figure 60: Europe Fluoroscopy Market Value & Volume, 2023-2030 ($)
Figure 61: U.K Fluoroscopy Market Value & Volume, 2023-2030 ($)
Figure 62: U.K GDP and Population, 2023-2030 ($)
Figure 63: U.K GDP – Composition of 2023, By Sector of Origin
Figure 64: U.K Export and Import Value & Volume, 2023-2030 ($)
Figure 65: Germany Fluoroscopy Market Value & Volume, 2023-2030 ($)
Figure 66: Germany GDP and Population, 2023-2030 ($)
Figure 67: Germany GDP – Composition of 2023, By Sector of Origin
Figure 68: Germany Export and Import Value & Volume, 2023-2030 ($)
Figure 69: Italy Fluoroscopy Market Value & Volume, 2023-2030 ($)
Figure 70: Italy GDP and Population, 2023-2030 ($)
Figure 71: Italy GDP – Composition of 2023, By Sector of Origin
Figure 72: Italy Export and Import Value & Volume, 2023-2030 ($)
Figure 73: France Fluoroscopy Market Value & Volume, 2023-2030 ($)
Figure 74: France GDP and Population, 2023-2030 ($)
Figure 75: France GDP – Composition of 2023, By Sector of Origin
Figure 76: France Export and Import Value & Volume, 2023-2030 ($)
Figure 77: Netherlands Fluoroscopy Market Value & Volume, 2023-2030 ($)
Figure 78: Netherlands GDP and Population, 2023-2030 ($)
Figure 79: Netherlands GDP – Composition of 2023, By Sector of Origin
Figure 80: Netherlands Export and Import Value & Volume, 2023-2030 ($)
Figure 81: Belgium Fluoroscopy Market Value & Volume, 2023-2030 ($)
Figure 82: Belgium GDP and Population, 2023-2030 ($)
Figure 83: Belgium GDP – Composition of 2023, By Sector of Origin
Figure 84: Belgium Export and Import Value & Volume, 2023-2030 ($)
Figure 85: Spain Fluoroscopy Market Value & Volume, 2023-2030 ($)
Figure 86: Spain GDP and Population, 2023-2030 ($)
Figure 87: Spain GDP – Composition of 2023, By Sector of Origin
Figure 88: Spain Export and Import Value & Volume, 2023-2030 ($)
Figure 89: Denmark Fluoroscopy Market Value & Volume, 2023-2030 ($)
Figure 90: Denmark GDP and Population, 2023-2030 ($)
Figure 91: Denmark GDP – Composition of 2023, By Sector of Origin
Figure 92: Denmark Export and Import Value & Volume, 2023-2030 ($)
Figure 93: APAC Fluoroscopy Market Value & Volume, 2023-2030 ($)
Figure 94: China Fluoroscopy Market Value & Volume, 2023-2030
Figure 95: China GDP and Population, 2023-2030 ($)
Figure 96: China GDP – Composition of 2023, By Sector of Origin
Figure 97: China Export and Import Value & Volume, 2023-2030 ($)Fluoroscopy Market China Export and Import Value & Volume, 2023-2030 ($)
Figure 98: Australia Fluoroscopy Market Value & Volume, 2023-2030 ($)
Figure 99: Australia GDP and Population, 2023-2030 ($)
Figure 100: Australia GDP – Composition of 2023, By Sector of Origin
Figure 101: Australia Export and Import Value & Volume, 2023-2030 ($)
Figure 102: South Korea Fluoroscopy Market Value & Volume, 2023-2030 ($)
Figure 103: South Korea GDP and Population, 2023-2030 ($)
Figure 104: South Korea GDP – Composition of 2023, By Sector of Origin
Figure 105: South Korea Export and Import Value & Volume, 2023-2030 ($)
Figure 106: India Fluoroscopy Market Value & Volume, 2023-2030 ($)
Figure 107: India GDP and Population, 2023-2030 ($)
Figure 108: India GDP – Composition of 2023, By Sector of Origin
Figure 109: India Export and Import Value & Volume, 2023-2030 ($)
Figure 110: Taiwan Fluoroscopy Market Value & Volume, 2023-2030 ($)
Figure 111: Taiwan GDP and Population, 2023-2030 ($)
Figure 112: Taiwan GDP – Composition of 2023, By Sector of Origin
Figure 113: Taiwan Export and Import Value & Volume, 2023-2030 ($)
Figure 114: Malaysia Fluoroscopy Market Value & Volume, 2023-2030 ($)
Figure 115: Malaysia GDP and Population, 2023-2030 ($)
Figure 116: Malaysia GDP – Composition of 2023, By Sector of Origin
Figure 117: Malaysia Export and Import Value & Volume, 2023-2030 ($)
Figure 118: Hong Kong Fluoroscopy Market Value & Volume, 2023-2030 ($)
Figure 119: Hong Kong GDP and Population, 2023-2030 ($)
Figure 120: Hong Kong GDP – Composition of 2023, By Sector of Origin
Figure 121: Hong Kong Export and Import Value & Volume, 2023-2030 ($)
Figure 122: Middle East & Africa Fluoroscopy Market Middle East & Africa 3D Printing Market Value & Volume, 2023-2030 ($)
Figure 123: Russia Fluoroscopy Market Value & Volume, 2023-2030 ($)
Figure 124: Russia GDP and Population, 2023-2030 ($)
Figure 125: Russia GDP – Composition of 2023, By Sector of Origin
Figure 126: Russia Export and Import Value & Volume, 2023-2030 ($)
Figure 127: Israel Fluoroscopy Market Value & Volume, 2023-2030 ($)
Figure 128: Israel GDP and Population, 2023-2030 ($)
Figure 129: Israel GDP – Composition of 2023, By Sector of Origin
Figure 130: Israel Export and Import Value & Volume, 2023-2030 ($)
Figure 131: Entropy Share, By Strategies, 2023-2030* (%)Fluoroscopy Market
Figure 132: Developments, 2023-2030*Fluoroscopy Market
Figure 133: Company 1 Fluoroscopy Market Net Revenue, By Years, 2023-2030* ($)
Figure 134: Company 1 Fluoroscopy Market Net Revenue Share, By Business segments, 2023 (%)
Figure 135: Company 1 Fluoroscopy Market Net Sales Share, By Geography, 2023 (%)
Figure 136: Company 2 Fluoroscopy Market Net Revenue, By Years, 2023-2030* ($)
Figure 137: Company 2 Fluoroscopy Market Net Revenue Share, By Business segments, 2023 (%)
Figure 138: Company 2 Fluoroscopy Market Net Sales Share, By Geography, 2023 (%)
Figure 139: Company 3 Fluoroscopy Market Net Revenue, By Years, 2023-2030* ($)
Figure 140: Company 3 Fluoroscopy Market Net Revenue Share, By Business segments, 2023 (%)
Figure 141: Company 3 Fluoroscopy Market Net Sales Share, By Geography, 2023 (%)
Figure 142: Company 4 Fluoroscopy Market Net Revenue, By Years, 2023-2030* ($)
Figure 143: Company 4 Fluoroscopy Market Net Revenue Share, By Business segments, 2023 (%)
Figure 144: Company 4 Fluoroscopy Market Net Sales Share, By Geography, 2023 (%)
Figure 145: Company 5 Fluoroscopy Market Net Revenue, By Years, 2023-2030* ($)
Figure 146: Company 5 Fluoroscopy Market Net Revenue Share, By Business segments, 2023 (%)
Figure 147: Company 5 Fluoroscopy Market Net Sales Share, By Geography, 2023 (%)
Figure 148: Company 6 Fluoroscopy Market Net Revenue, By Years, 2023-2030* ($)
Figure 149: Company 6 Fluoroscopy Market Net Revenue Share, By Business segments, 2023 (%)
Figure 150: Company 6 Fluoroscopy Market Net Sales Share, By Geography, 2023 (%)
Figure 151: Company 7 Fluoroscopy Market Net Revenue, By Years, 2023-2030* ($)
Figure 152: Company 7 Fluoroscopy Market Net Revenue Share, By Business segments, 2023 (%)
Figure 153: Company 7 Fluoroscopy Market Net Sales Share, By Geography, 2023 (%)
Figure 154: Company 8 Fluoroscopy Market Net Revenue, By Years, 2023-2030* ($)
Figure 155: Company 8 Fluoroscopy Market Net Revenue Share, By Business segments, 2023 (%)
Figure 156: Company 8 Fluoroscopy Market Net Sales Share, By Geography, 2023 (%)
Figure 157: Company 9 Fluoroscopy Market Net Revenue, By Years, 2023-2030* ($)
Figure 158: Company 9 Fluoroscopy Market Net Revenue Share, By Business segments, 2023 (%)
Figure 159: Company 9 Fluoroscopy Market Net Sales Share, By Geography, 2023 (%)
Figure 160: Company 10 Fluoroscopy Market Net Revenue, By Years, 2023-2030* ($)
Figure 161: Company 10 Fluoroscopy Market Net Revenue Share, By Business segments, 2023 (%)
Figure 162: Company 10 Fluoroscopy Market Net Sales Share, By Geography, 2023 (%)
Figure 163: Company 11 Fluoroscopy Market Net Revenue, By Years, 2023-2030* ($)
Figure 164: Company 11 Fluoroscopy Market Net Revenue Share, By Business segments, 2023 (%)
Figure 165: Company 11 Fluoroscopy Market Net Sales Share, By Geography, 2023 (%)
Figure 166: Company 12 Fluoroscopy Market Net Revenue, By Years, 2023-2030* ($)
Figure 167: Company 12 Fluoroscopy Market Net Revenue Share, By Business segments, 2023 (%)
Figure 168: Company 12 Fluoroscopy Market Net Sales Share, By Geography, 2023 (%)
Figure 169: Company 13 Fluoroscopy Market Net Revenue, By Years, 2023-2030* ($)
Figure 170: Company 13 Fluoroscopy Market Net Revenue Share, By Business segments, 2023 (%)
Figure 171: Company 13 Fluoroscopy Market Net Sales Share, By Geography, 2023 (%)
Figure 172: Company 14 Fluoroscopy Market Net Revenue, By Years, 2023-2030* ($)
Figure 173: Company 14 Fluoroscopy Market Net Revenue Share, By Business segments, 2023 (%)
Figure 174: Company 14 Fluoroscopy Market Net Sales Share, By Geography, 2023 (%)
Figure 175: Company 15 Fluoroscopy Market Net Revenue, By Years, 2023-2030* ($)
Figure 176: Company 15 Fluoroscopy Market Net Revenue Share, By Business segments, 2023 (%)
Figure 177: Company 15 Fluoroscopy Market Net Sales Share, By Geography, 2023 (%)