 Email
Email Print
Print


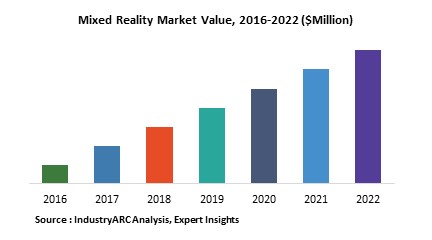
Mixed Reality Market - By Technology , By Display Devices , By Application By End User Industries , By Geography - Forecast (2024 - 2030)
The Global Mixed Reality Market Size is forecast to reach $ 166637 Million by 2030, at a CAGR of 67% during forecast period 2024-2030. Software and Hardware are witnessed as fast growing in the market with $718.5 and 336.5 million revenue with a CAGR of 69.1% and 81.4% respectively. Eye Glass Display Device holds $321.4 m in 2017 with 66.1% growth rate. Mixed Reality technology is going to uplift the market from infant phase to extreme extent.
What is Mixed Reality Market?
Mixed reality symbolizes the controlled collision of the AR/VR and IoT trends. It is the merging of Real and Virtual worlds to develop new visualizations and environments in which both digital and physical objects and their data can co-exist and interact with each other. MR displays images on semi-transparent materials using a projector, then it will get reflected to the eye with the help of beam-splitting technology. MR is applied on various places like maintenance & operations, production, design & development, reporting & analytics, quality control and distribution.
This report incorporates an in-depth assessment of Mixed Reality Market by Technology, Display Devices, End-User, Application and Geography.
What are the major applications for Mixed Reality Market?
The various end-users assessed includes Maintenance, Defense, Archaeology & Tourism, Architecture & Construction, Interactive Product Content Management (IPCM), Simulation Based Learning (SBL), Navigation, Gaming and Entertainment, Medical and Education and Sports. Combination of augmented and virtual reality increases the productivity, accuracy and safety of maintenance. Much useful in military training and situational positions like in the battle field. Now-a-days populace are more engaged in gaming and entertainment which is soon going to boost the market in this sector.
Market Research and Market Trends of Mixed Reality Market
- Mixed Reality is fueling the investments in devices, software ecosystems and platforms. The ultimate goal of these investments is to replace keyboards and flat displays with entirely new business pattern in the industry. This would emerge and enhance the market to whole new level in user engagement in the modern technological era. Every single improvement made to user interface patterns, results in functioning of keys, clicking, touching and swiping, and now offers a chance to progress “beyond the glass” of conventional displays used. Technology influences the market globally which leads to the increment of market size and growth.
- Collaborating on a real world is a dynamic and easy interchange of focus between the shared workspace and interpersonal space is the common communications space between them. And now, Microsoft is involved to support the mixed reality which means, in a year or two, almost everyone will be able to enjoy moving between realities at home and at work. Enterprises will embrace and adopt mixed reality as the growth is high than the predictions. MR helps the organizations to expand in real-time communication by enabling everyone to gain the real-time experience according to the user’s preferences. Implementation with business goals can also transform an organization’s work culture, enable people to collaborate more naturally and efficiently by leading them to reduce operational costs.
- The enterprise potential of mixed reality continues to grow as companies explore and move beyond pilot applications. Enhanced efforts integrate the opportunities made by IoT technology with the aid of sensors and connected devices that assists to build a more incorporated physical and digital landscape resulting high investments in infrastructure. Wearable’s technology is one of the basis for the most advanced and immersive mixed reality experiences where market evolves. Wearables will find many users in the industry and enterprise as its growth in the market is very high. Many types of field operations such as maintenance and delivery services may benefit from wearable, as it was the most notable recent developments in Microsoft’s HoloLens.
Who are the Major Players in Mixed Reality market?
The companies referred to the market research report includes Oculus VR, LLC, Infinity Augmented Reality, Inc., Meta Company, Atheer, Inc., Vuzix Corporation, Canon, Inc., HTC Corporation , Daqri, LLC., Sulon Technologies Inc., Lumus Ltd. and more than 20 companies.
What is our report scope?
The report incorporates in-depth assessment of the competitive landscape, product market sizing, product benchmarking, market trends, product developments, financial analysis, strategic analysis and so on to gauge the impact forces and potential opportunities of the market. Apart from this the report also includes a study of major developments in the market such as product launches, agreements, acquisitions, collaborations, mergers and so on to comprehend the prevailing market dynamics at present and its impact during the forecast period 2024-2030.
All our reports are customizable to your company needs to a certain extent, we do provide 20 free consulting hours along with purchase of each report, and this will allow you to request any additional data to customize the report to your needs.
Key Takeaways from this Report
- Evaluate market potential through analyzing growth rates (CAGR %), Volume (Units) and Value ($M) data given at country level – for product types, end use applications and by different industry verticals.
- Understand the different dynamics influencing the market – key driving factors, challenges and hidden opportunities.
- Get in-depth insights on your competitor performance – market shares, strategies, financial benchmarking, product benchmarking, SWOT and more.
- Analyze the sales and distribution channels across key geographies to improve top-line revenues.
- Understand the industry supply chain with a deep-dive on the value augmentation at each step, in order to optimize value and bring efficiencies in your processes.
- Get a quick outlook on the market entropy – M&A’s, deals, partnerships, product launches of all key players for the past 4 years.
- Evaluate the supply-demand gaps, import-export statistics and regulatory landscape for more than top 20 countries globally for the market.
Key Market Players:
The Top 5 companies in the Mixed Reality Market Market are:
- Microsoft Corporation
- Magic Leap, Inc.
- Oculus VR (Facebook Technologies, LLC)
- Sony Corporation
- HTC Corporation
For more ICT related reports, please click here
1. Mixed Reality Market Overview
2. Mixed Reality Market Executive Summary
3. Mixed Reality Market Landscape
3.1. Market Share Analysis
3.2. Comparative Analysis
3.2.1. Product Benchmarking
3.2.2. End User profiling
3.2.3. Patent Analysis
3.2.4. Top 5 Financials Analysis
4. Mixed Reality Market Forces
4.1. Market Drivers
4.2. Market Constraints
4.3. Market Challenges
4.4. Attractiveness of the Industry
4.4.1. Power of Suppliers
4.4.2. Power of Customers
4.4.3. Threat of New entrants
4.4.4. Threat of Substitution
4.4.5. Degree of Competition
5. Mixed Reality Market – Strategic Analysis
5.1. Value Chain Analysis
5.2. Opportunities Analysis
5.3. Product/Market Life Cycle Analysis
5.4. Suppliers and Distributors
6. Mixed Reality Market - By Technology
6.1. Hardware
6.1.1. Processor
6.1.2. Display
6.1.2.1. Visual
6.1.2.2. Audio or Sonic
6.1.2.3. Haptic
6.1.2.4. Others
6.1.3. Sensors
6.1.3.1. Gyroscope
6.1.3.2. Accelerometer
6.1.3.3. Magnetometer
6.1.3.4. Proximity Sensors
6.1.3.5 Others
6.1.4. Input devices
6.1.4.1 Buttons
6.1.4.2 Touchscreen
6.1.4.3 Others
6.2. Software and Algorithms
7. Mixed Reality Market - By Display Devices
7.1. Introduction
7.2. CAVE
7.3. Head-Up Display (HUD)
7.4. Head-Mounted Display
7.5. Personal Digital Assistant
7.6. Eyeglasses
8. Mixed Reality Market – By End-User
8.1. Introduction
8.2. Aerospace & Defense
8.3. Archaeology & Tourism
8.4. Architecture & Construction
8.5. Industrial & Manufacturing
8.6. Gaming and Entertainment
8.7. Medical
8.8. Government
8.9. Retail
8.10 Education
8.11 Sports
8.12. Others
9. Mixed Reality Market – By Application
9.1. Introduction
9.2. Maintenance
9.3. Military Training
9.4. Interactive Product Content Management (IPCM)
9.5. Simulation Based Learning (SBL)
9.6. Navigation
9.7. Others
10. Mixed Reality Market - By Geography
10.1. North America
10.1.1. U.S.
10.1.2. Canada
10.1.3. Mexico
10.1.4. Rest of North America
10.2. South America
10.2.1. Brazil
10.2.2. Venezuela
10.2.3. Argentina
10.2.4. Ecuador
10.2.5. Peru
10.2.6. Colombia
10.2.7. Costa Rica
10.2.8. Rest of South America
10.3. Europe
10.3.1. U.K
10.3.2. Germany
10.3.3. Italy
10.3.4. France
10.3.5. Netherlands
10.3.6. Belgium
10.3.7. Spain
10.3.8. Denmark
10.3.9. Rest of Europe
10.4. APAC
10.4.1. China
10.4.2. Australia
10.4.3. South Korea
10.4.4. India
10.4.5. Taiwan
10.4.6. Malaysia
10.4.7. Hong Kong
10.4.8. Rest of APAC
10.5. Middle East& Africa
10.5.1. Israel
10.5.2. South Africa
10.5.3. Saudi Arabia
10.6. Rest of Middle East and Africa
11. Market Entropy
11.1. New Product Launches
11.2. M&As, Collaborations, JVs, Partnership
12. Company Profiles (Overview, Financials, SWOT Analysis, Developments, Product Portfolio)
12.1. Oculus VR LLC
12.2. Infinity Augmented Reality, Inc
12.3. Meta Company
12.4. Atheer, Inc
12.5. Vuzix Corporation
12.6. Canon, Inc
12.7. HTC Corporation
12.8. Daqri LLC.
12.9. Sulon Technologies Inc.
12.10. Lumus Ltd.
*More than 10 Companies are profiled in this Research Report*
"*Financials would be provided on a best efforts basis for private companies"
13. Appendix
13.1. Abbreviations
13.2. Sources
13.3. Research Methodology
13.4. Bibliography
13.5. Compilation of Expert Insights
13.6. Disclaimer
List of Tables
Table 1: Mixed Reality Market Overview 2023-2030
Table 2: Mixed Reality Market Leader Analysis 2023-2024 (US$)
Table 3: Mixed Reality Market Product Analysis 2023-2024 (US$)
Table 4: Mixed Reality Market End User Analysis 2023-2024 (US$)
Table 5: Mixed Reality Market Patent Analysis 2021-2023* (US$)
Table 6: Mixed Reality Market Financial Analysis 2023-2024 (US$)
Table 7: Mixed Reality Market Driver Analysis 2023-2024 (US$)
Table 8: Mixed Reality Market Challenges Analysis 2023-2024 (US$)
Table 9: Mixed Reality Market Constraint Analysis 2023-2024 (US$)
Table 10: Mixed Reality Market Supplier Bargaining Power Analysis 2023-2024 (US$)
Table 11: Mixed Reality Market Buyer Bargaining Power Analysis 2023-2024 (US$)
Table 12: Mixed Reality Market Threat of Substitutes Analysis 2023-2024 (US$)
Table 13: Mixed Reality Market Threat of New Entrants Analysis 2023-2024 (US$)
Table 14: Mixed Reality Market Degree of Competition Analysis 2023-2024 (US$)
Table 15: Mixed Reality Market Value Chain Analysis 2023-2024 (US$)
Table 16: Mixed Reality Market Pricing Analysis 2023-2030 (US$)
Table 17: Mixed Reality Market Opportunities Analysis 2023-2030 (US$)
Table 18: Mixed Reality Market Product Life Cycle Analysis 2023-2030 (US$)
Table 19: Mixed Reality Market Supplier Analysis 2023-2024 (US$)
Table 20: Mixed Reality Market Distributor Analysis 2023-2024 (US$)
Table 21: Mixed Reality Market Trend Analysis 2023-2024 (US$)
Table 22: Mixed Reality Market Size 2023 (US$)
Table 23: Mixed Reality Market Forecast Analysis 2023-2030 (US$)
Table 24: Mixed Reality Market Sales Forecast Analysis 2023-2030 (Units)
Table 25: Mixed Reality Market, Revenue & Volume, By Display Devices, 2023-2030 ($)
Table 26: Mixed Reality Market By Display Devices, Revenue & Volume, By CAVE, 2023-2030 ($)
Table 27: Mixed Reality Market By Display Devices, Revenue & Volume, By Head-Up Display (HUD), 2023-2030 ($)
Table 28: Mixed Reality Market By Display Devices, Revenue & Volume, By Head-Mounted Display, 2023-2030 ($)
Table 29: Mixed Reality Market By Display Devices, Revenue & Volume, By Personal Digital Assistant, 2023-2030 ($)
Table 30: Mixed Reality Market By Display Devices, Revenue & Volume, By Eyeglasses, 2023-2030 ($)
Table 31: Mixed Reality Market, Revenue & Volume, By Technology, 2023-2030 ($)
Table 32: Mixed Reality Market By Technology, Revenue & Volume, By Hardware, 2023-2030 ($)
Table 33: Mixed Reality Market By Technology, Revenue & Volume, By Software and Algorithms, 2023-2030 ($)
Table 34: Mixed Reality Market, Revenue & Volume, By Application, 2023-2030 ($)
Table 35: Mixed Reality Market By Application, Revenue & Volume, By Maintenance, 2023-2030 ($)
Table 36: Mixed Reality Market By Application, Revenue & Volume, By Military Training, 2023-2030 ($)
Table 37: Mixed Reality Market By Application, Revenue & Volume, By Interactive Product Content Management (IPCM), 2023-2030 ($)
Table 38: Mixed Reality Market By Application, Revenue & Volume, By Simulation Based Learning (SBL), 2023-2030 ($)
Table 39: Mixed Reality Market By Application, Revenue & Volume, By Navigation, 2023-2030 ($)
Table 40: Mixed Reality Market, Revenue & Volume, By End User, 2023-2030 ($)
Table 41: Mixed Reality Market By End User, Revenue & Volume, By Aerospace & Defense, 2023-2030 ($)
Table 42: Mixed Reality Market By End User, Revenue & Volume, By Archaeology & Tourism, 2023-2030 ($)
Table 43: Mixed Reality Market By End User, Revenue & Volume, By Architecture & Construction, 2023-2030 ($)
Table 44: Mixed Reality Market By End User, Revenue & Volume, By Industrial & Manufacturing, 2023-2030 ($)
Table 45: Mixed Reality Market By End User, Revenue & Volume, By Gaming and Entertainment, 2023-2030 ($)
Table 46: North America Mixed Reality Market, Revenue & Volume, By Display Devices, 2023-2030 ($)
Table 47: North America Mixed Reality Market, Revenue & Volume, By Technology, 2023-2030 ($)
Table 48: North America Mixed Reality Market, Revenue & Volume, By Application, 2023-2030 ($)
Table 49: North America Mixed Reality Market, Revenue & Volume, By End User, 2023-2030 ($)
Table 50: South america Mixed Reality Market, Revenue & Volume, By Display Devices, 2023-2030 ($)
Table 51: South america Mixed Reality Market, Revenue & Volume, By Technology, 2023-2030 ($)
Table 52: South america Mixed Reality Market, Revenue & Volume, By Application, 2023-2030 ($)
Table 53: South america Mixed Reality Market, Revenue & Volume, By End User, 2023-2030 ($)
Table 54: Europe Mixed Reality Market, Revenue & Volume, By Display Devices, 2023-2030 ($)
Table 55: Europe Mixed Reality Market, Revenue & Volume, By Technology, 2023-2030 ($)
Table 56: Europe Mixed Reality Market, Revenue & Volume, By Application, 2023-2030 ($)
Table 57: Europe Mixed Reality Market, Revenue & Volume, By End User, 2023-2030 ($)
Table 58: APAC Mixed Reality Market, Revenue & Volume, By Display Devices, 2023-2030 ($)
Table 59: APAC Mixed Reality Market, Revenue & Volume, By Technology, 2023-2030 ($)
Table 60: APAC Mixed Reality Market, Revenue & Volume, By Application, 2023-2030 ($)
Table 61: APAC Mixed Reality Market, Revenue & Volume, By End User, 2023-2030 ($)
Table 62: Middle East & Africa Mixed Reality Market, Revenue & Volume, By Display Devices, 2023-2030 ($)
Table 63: Middle East & Africa Mixed Reality Market, Revenue & Volume, By Technology, 2023-2030 ($)
Table 64: Middle East & Africa Mixed Reality Market, Revenue & Volume, By Application, 2023-2030 ($)
Table 65: Middle East & Africa Mixed Reality Market, Revenue & Volume, By End User, 2023-2030 ($)
Table 66: Russia Mixed Reality Market, Revenue & Volume, By Display Devices, 2023-2030 ($)
Table 67: Russia Mixed Reality Market, Revenue & Volume, By Technology, 2023-2030 ($)
Table 68: Russia Mixed Reality Market, Revenue & Volume, By Application, 2023-2030 ($)
Table 69: Russia Mixed Reality Market, Revenue & Volume, By End User, 2023-2030 ($)
Table 70: Israel Mixed Reality Market, Revenue & Volume, By Display Devices, 2023-2030 ($)
Table 71: Israel Mixed Reality Market, Revenue & Volume, By Technology, 2023-2030 ($)
Table 72: Israel Mixed Reality Market, Revenue & Volume, By Application, 2023-2030 ($)
Table 73: Israel Mixed Reality Market, Revenue & Volume, By End User, 2023-2030 ($)
Table 74: Top Companies 2023 (US$)Mixed Reality Market, Revenue & Volume
Table 75: Product Launch 2023-2024Mixed Reality Market, Revenue & Volume
Table 76: Mergers & Acquistions 2023-2024Mixed Reality Market, Revenue & Volume
List of Figures
Figure 1: Overview of Mixed Reality Market 2023-2030
Figure 2: Market Share Analysis for Mixed Reality Market 2023 (US$)
Figure 3: Product Comparison in Mixed Reality Market 2023-2024 (US$)
Figure 4: End User Profile for Mixed Reality Market 2023-2024 (US$)
Figure 5: Patent Application and Grant in Mixed Reality Market 2021-2023* (US$)
Figure 6: Top 5 Companies Financial Analysis in Mixed Reality Market 2023-2024 (US$)
Figure 7: Market Entry Strategy in Mixed Reality Market 2023-2024
Figure 8: Ecosystem Analysis in Mixed Reality Market 2023
Figure 9: Average Selling Price in Mixed Reality Market 2023-2030
Figure 10: Top Opportunites in Mixed Reality Market 2023-2024
Figure 11: Market Life Cycle Analysis in Mixed Reality Market
Figure 12: GlobalBy Display DevicesMixed Reality Market Revenue, 2023-2030 ($)
Figure 13: GlobalBy TechnologyMixed Reality Market Revenue, 2023-2030 ($)
Figure 14: GlobalBy ApplicationMixed Reality Market Revenue, 2023-2030 ($)
Figure 15: GlobalBy End UserMixed Reality Market Revenue, 2023-2030 ($)
Figure 16: Global Mixed Reality Market - By Geography
Figure 17: Global Mixed Reality Market Value & Volume, By Geography, 2023-2030 ($)
Figure 18: Global Mixed Reality Market CAGR, By Geography, 2023-2030 (%)
Figure 19: North America Mixed Reality Market Value & Volume, 2023-2030 ($)
Figure 20: US Mixed Reality Market Value & Volume, 2023-2030 ($)
Figure 21: US GDP and Population, 2023-2024 ($)
Figure 22: US GDP – Composition of 2023, By Sector of Origin
Figure 23: US Export and Import Value & Volume, 2023-2024 ($)
Figure 24: Canada Mixed Reality Market Value & Volume, 2023-2030 ($)
Figure 25: Canada GDP and Population, 2023-2024 ($)
Figure 26: Canada GDP – Composition of 2023, By Sector of Origin
Figure 27: Canada Export and Import Value & Volume, 2023-2024 ($)
Figure 28: Mexico Mixed Reality Market Value & Volume, 2023-2030 ($)
Figure 29: Mexico GDP and Population, 2023-2024 ($)
Figure 30: Mexico GDP – Composition of 2023, By Sector of Origin
Figure 31: Mexico Export and Import Value & Volume, 2023-2024 ($)
Figure 32: South America Mixed Reality Market Value & Volume, 2023-2030 ($)
Figure 33: Brazil Mixed Reality Market Value & Volume, 2023-2030 ($)
Figure 34: Brazil GDP and Population, 2023-2024 ($)
Figure 35: Brazil GDP – Composition of 2023, By Sector of Origin
Figure 36: Brazil Export and Import Value & Volume, 2023-2024 ($)
Figure 37: Venezuela Mixed Reality Market Value & Volume, 2023-2030 ($)
Figure 38: Venezuela GDP and Population, 2023-2024 ($)
Figure 39: Venezuela GDP – Composition of 2023, By Sector of Origin
Figure 40: Venezuela Export and Import Value & Volume, 2023-2024 ($)
Figure 41: Argentina Mixed Reality Market Value & Volume, 2023-2030 ($)
Figure 42: Argentina GDP and Population, 2023-2024 ($)
Figure 43: Argentina GDP – Composition of 2023, By Sector of Origin
Figure 44: Argentina Export and Import Value & Volume, 2023-2024 ($)
Figure 45: Ecuador Mixed Reality Market Value & Volume, 2023-2030 ($)
Figure 46: Ecuador GDP and Population, 2023-2024 ($)
Figure 47: Ecuador GDP – Composition of 2023, By Sector of Origin
Figure 48: Ecuador Export and Import Value & Volume, 2023-2024 ($)
Figure 49: Peru Mixed Reality Market Value & Volume, 2023-2030 ($)
Figure 50: Peru GDP and Population, 2023-2024 ($)
Figure 51: Peru GDP – Composition of 2023, By Sector of Origin
Figure 52: Peru Export and Import Value & Volume, 2023-2024 ($)
Figure 53: Colombia Mixed Reality Market Value & Volume, 2023-2030 ($)
Figure 54: Colombia GDP and Population, 2023-2024 ($)
Figure 55: Colombia GDP – Composition of 2023, By Sector of Origin
Figure 56: Colombia Export and Import Value & Volume, 2023-2024 ($)
Figure 57: Costa Rica Mixed Reality Market Value & Volume, 2023-2030 ($)
Figure 58: Costa Rica GDP and Population, 2023-2024 ($)
Figure 59: Costa Rica GDP – Composition of 2023, By Sector of Origin
Figure 60: Costa Rica Export and Import Value & Volume, 2023-2024 ($)
Figure 61: Europe Mixed Reality Market Value & Volume, 2023-2030 ($)
Figure 62: U.K Mixed Reality Market Value & Volume, 2023-2030 ($)
Figure 63: U.K GDP and Population, 2023-2024 ($)
Figure 64: U.K GDP – Composition of 2023, By Sector of Origin
Figure 65: U.K Export and Import Value & Volume, 2023-2024 ($)
Figure 66: Germany Mixed Reality Market Value & Volume, 2023-2030 ($)
Figure 67: Germany GDP and Population, 2023-2024 ($)
Figure 68: Germany GDP – Composition of 2023, By Sector of Origin
Figure 69: Germany Export and Import Value & Volume, 2023-2024 ($)
Figure 70: Italy Mixed Reality Market Value & Volume, 2023-2030 ($)
Figure 71: Italy GDP and Population, 2023-2024 ($)
Figure 72: Italy GDP – Composition of 2023, By Sector of Origin
Figure 73: Italy Export and Import Value & Volume, 2023-2024 ($)
Figure 74: France Mixed Reality Market Value & Volume, 2023-2030 ($)
Figure 75: France GDP and Population, 2023-2024 ($)
Figure 76: France GDP – Composition of 2023, By Sector of Origin
Figure 77: France Export and Import Value & Volume, 2023-2024 ($)
Figure 78: Netherlands Mixed Reality Market Value & Volume, 2023-2030 ($)
Figure 79: Netherlands GDP and Population, 2023-2024 ($)
Figure 80: Netherlands GDP – Composition of 2023, By Sector of Origin
Figure 81: Netherlands Export and Import Value & Volume, 2023-2024 ($)
Figure 82: Belgium Mixed Reality Market Value & Volume, 2023-2030 ($)
Figure 83: Belgium GDP and Population, 2023-2024 ($)
Figure 84: Belgium GDP – Composition of 2023, By Sector of Origin
Figure 85: Belgium Export and Import Value & Volume, 2023-2024 ($)
Figure 86: Spain Mixed Reality Market Value & Volume, 2023-2030 ($)
Figure 87: Spain GDP and Population, 2023-2024 ($)
Figure 88: Spain GDP – Composition of 2023, By Sector of Origin
Figure 89: Spain Export and Import Value & Volume, 2023-2024 ($)
Figure 90: Denmark Mixed Reality Market Value & Volume, 2023-2030 ($)
Figure 91: Denmark GDP and Population, 2023-2024 ($)
Figure 92: Denmark GDP – Composition of 2023, By Sector of Origin
Figure 93: Denmark Export and Import Value & Volume, 2023-2024 ($)
Figure 94: APAC Mixed Reality Market Value & Volume, 2023-2030 ($)
Figure 95: China Mixed Reality Market Value & Volume, 2023-2030
Figure 96: China GDP and Population, 2023-2024 ($)
Figure 97: China GDP – Composition of 2023, By Sector of Origin
Figure 98: China Export and Import Value & Volume, 2023-2024 ($)Mixed Reality Market China Export and Import Value & Volume, 2023-2024 ($)
Figure 99: Australia Mixed Reality Market Value & Volume, 2023-2030 ($)
Figure 100: Australia GDP and Population, 2023-2024 ($)
Figure 101: Australia GDP – Composition of 2023, By Sector of Origin
Figure 102: Australia Export and Import Value & Volume, 2023-2024 ($)
Figure 103: South Korea Mixed Reality Market Value & Volume, 2023-2030 ($)
Figure 104: South Korea GDP and Population, 2023-2024 ($)
Figure 105: South Korea GDP – Composition of 2023, By Sector of Origin
Figure 106: South Korea Export and Import Value & Volume, 2023-2024 ($)
Figure 107: India Mixed Reality Market Value & Volume, 2023-2030 ($)
Figure 108: India GDP and Population, 2023-2024 ($)
Figure 109: India GDP – Composition of 2023, By Sector of Origin
Figure 110: India Export and Import Value & Volume, 2023-2024 ($)
Figure 111: Taiwan Mixed Reality Market Value & Volume, 2023-2030 ($)
Figure 112: Taiwan GDP and Population, 2023-2024 ($)
Figure 113: Taiwan GDP – Composition of 2023, By Sector of Origin
Figure 114: Taiwan Export and Import Value & Volume, 2023-2024 ($)
Figure 115: Malaysia Mixed Reality Market Value & Volume, 2023-2030 ($)
Figure 116: Malaysia GDP and Population, 2023-2024 ($)
Figure 117: Malaysia GDP – Composition of 2023, By Sector of Origin
Figure 118: Malaysia Export and Import Value & Volume, 2023-2024 ($)
Figure 119: Hong Kong Mixed Reality Market Value & Volume, 2023-2030 ($)
Figure 120: Hong Kong GDP and Population, 2023-2024 ($)
Figure 121: Hong Kong GDP – Composition of 2023, By Sector of Origin
Figure 122: Hong Kong Export and Import Value & Volume, 2023-2024 ($)
Figure 123: Middle East & Africa Mixed Reality Market Middle East & Africa 3D Printing Market Value & Volume, 2023-2030 ($)
Figure 124: Russia Mixed Reality Market Value & Volume, 2023-2030 ($)
Figure 125: Russia GDP and Population, 2023-2024 ($)
Figure 126: Russia GDP – Composition of 2023, By Sector of Origin
Figure 127: Russia Export and Import Value & Volume, 2023-2024 ($)
Figure 128: Israel Mixed Reality Market Value & Volume, 2023-2030 ($)
Figure 129: Israel GDP and Population, 2023-2024 ($)
Figure 130: Israel GDP – Composition of 2023, By Sector of Origin
Figure 131: Israel Export and Import Value & Volume, 2023-2024 ($)
Figure 132: Entropy Share, By Strategies, 2023-2024* (%)Mixed Reality Market
Figure 133: Developments, 2023-2024*Mixed Reality Market
Figure 134: Company 1 Mixed Reality Market Net Revenue, By Years, 2023-2024* ($)
Figure 135: Company 1 Mixed Reality Market Net Revenue Share, By Business segments, 2023 (%)
Figure 136: Company 1 Mixed Reality Market Net Sales Share, By Geography, 2023 (%)
Figure 137: Company 2 Mixed Reality Market Net Revenue, By Years, 2023-2024* ($)
Figure 138: Company 2 Mixed Reality Market Net Revenue Share, By Business segments, 2023 (%)
Figure 139: Company 2 Mixed Reality Market Net Sales Share, By Geography, 2023 (%)
Figure 140: Company 3 Mixed Reality Market Net Revenue, By Years, 2023-2024* ($)
Figure 141: Company 3 Mixed Reality Market Net Revenue Share, By Business segments, 2023 (%)
Figure 142: Company 3 Mixed Reality Market Net Sales Share, By Geography, 2023 (%)
Figure 143: Company 4 Mixed Reality Market Net Revenue, By Years, 2023-2024* ($)
Figure 144: Company 4 Mixed Reality Market Net Revenue Share, By Business segments, 2023 (%)
Figure 145: Company 4 Mixed Reality Market Net Sales Share, By Geography, 2023 (%)
Figure 146: Company 5 Mixed Reality Market Net Revenue, By Years, 2023-2024* ($)
Figure 147: Company 5 Mixed Reality Market Net Revenue Share, By Business segments, 2023 (%)
Figure 148: Company 5 Mixed Reality Market Net Sales Share, By Geography, 2023 (%)
Figure 149: Company 6 Mixed Reality Market Net Revenue, By Years, 2023-2024* ($)
Figure 150: Company 6 Mixed Reality Market Net Revenue Share, By Business segments, 2023 (%)
Figure 151: Company 6 Mixed Reality Market Net Sales Share, By Geography, 2023 (%)
Figure 152: Company 7 Mixed Reality Market Net Revenue, By Years, 2023-2024* ($)
Figure 153: Company 7 Mixed Reality Market Net Revenue Share, By Business segments, 2023 (%)
Figure 154: Company 7 Mixed Reality Market Net Sales Share, By Geography, 2023 (%)
Figure 155: Company 8 Mixed Reality Market Net Revenue, By Years, 2023-2024* ($)
Figure 156: Company 8 Mixed Reality Market Net Revenue Share, By Business segments, 2023 (%)
Figure 157: Company 8 Mixed Reality Market Net Sales Share, By Geography, 2023 (%)
Figure 158: Company 9 Mixed Reality Market Net Revenue, By Years, 2023-2024* ($)
Figure 159: Company 9 Mixed Reality Market Net Revenue Share, By Business segments, 2023 (%)
Figure 160: Company 9 Mixed Reality Market Net Sales Share, By Geography, 2023 (%)
Figure 161: Company 10 Mixed Reality Market Net Revenue, By Years, 2023-2024* ($)
Figure 162: Company 10 Mixed Reality Market Net Revenue Share, By Business segments, 2023 (%)
Figure 163: Company 10 Mixed Reality Market Net Sales Share, By Geography, 2023 (%)
Figure 164: Company 11 Mixed Reality Market Net Revenue, By Years, 2023-2024* ($)
Figure 165: Company 11 Mixed Reality Market Net Revenue Share, By Business segments, 2023 (%)
Figure 166: Company 11 Mixed Reality Market Net Sales Share, By Geography, 2023 (%)
Figure 167: Company 12 Mixed Reality Market Net Revenue, By Years, 2023-2024* ($)
Figure 168: Company 12 Mixed Reality Market Net Revenue Share, By Business segments, 2023 (%)
Figure 169: Company 12 Mixed Reality Market Net Sales Share, By Geography, 2023 (%)
Figure 170: Company 13 Mixed Reality Market Net Revenue, By Years, 2023-2024* ($)
Figure 171: Company 13 Mixed Reality Market Net Revenue Share, By Business segments, 2023 (%)
Figure 172: Company 13 Mixed Reality Market Net Sales Share, By Geography, 2023 (%)
Figure 173: Company 14 Mixed Reality Market Net Revenue, By Years, 2023-2024* ($)
Figure 174: Company 14 Mixed Reality Market Net Revenue Share, By Business segments, 2023 (%)
Figure 175: Company 14 Mixed Reality Market Net Sales Share, By Geography, 2023 (%)
Figure 176: Company 15 Mixed Reality Market Net Revenue, By Years, 2023-2024* ($)
Figure 177: Company 15 Mixed Reality Market Net Revenue Share, By Business segments, 2023 (%)
Figure 178: Company 15 Mixed Reality Market Net Sales Share, By Geography, 2023 (%)