 Email
Email Print
Print


Modified Starch Market - By types of modified starch; By functions , By End User Industry , By raw materials , By Production methods , By Geography - Forecast (2024 - 2030)
Modified starch market Overview:
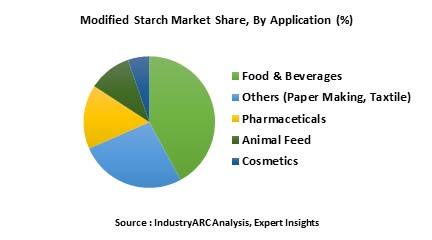
Modified Starch Market Size is forecast to reach $ 16619.7 Million by 2030, at a CAGR of 3.30% during forecast period 2024-2030.Modified starch serves different purposes in different industries. Modified starch is majorly used in food and beverages industry as a thickening agent or as a stabilizer.
Modified starch market Outlook:
The modified starch market can be classified with respect to raw materials used, functions of the modified starch, end user industries using modified starch and different regions’ market. The modified starch is produced using different modification methods like physical modifications, chemical modifications, enzymatic modification and genetic modification. There are different types of modified starch available like Pregelatinized Starch, Cross-Linked Starch, Oxidized Starch, Cationic Starch, Anionic Starch and others.
Modified starch market Growth drivers:
The food and beverage industry uses modified starch as a fat replacer, texture improver and nutritional value enhancer. The demand for packaged food has seen an inclination in the recent period. The global market for packaged food is valued approximately at $ 2.6 trillion in 2017 and it is growing at an estimated CAGR of 4.5%.
Modified starch market Challenges:
Modified starch market has many benefits in various applications. Modified starch has been advancing in terms of its properties because of the improvements in its production technologies. However, modified starch ingredients have been facing competition from specialized ingredients that are used for limited applications. Gum Arabic is one among the specialized ingredients which is used in beverage industry.
Modified starch market Research Scope:
The base year of the study is 2023, with forecast done up to 2030. The study presents a thorough analysis of the competitive landscape, taking into account the market shares of the leading companies. It also provides information on unit shipments. These provide the key market participants with the necessary business intelligence and help them understand the future of the Modified starch market. The assessment includes the forecast, an overview of the competitive structure, the market shares of the competitors, as well as the market trends, market demands, market drivers, market challenges, and product analysis. The market drivers and restraints have been assessed to fathom their impact over the forecast period. This report further identifies the key opportunities for growth while also detailing the key challenges and possible threats.
Modified Starch (SAP) Market Report: Industry Coverage:
Modified starch market– By Raw materials: Corn, cassava, potato, wheat and others
Modified starch market – By Types: Pregelatinized Starch, Cross-Linked Starch, Oxidized Starch, Cationic Starch, Anionic Starch, Thinned Starch, Acetylated Starch, Dextrin, Grafted Starch, Ethers Starch, Physically Modified Starch, Enzyme Modified Starch
Modified starch market – By Production methods: Physical methods: Heat–moisture Treatment, Annealing, Retrogradation, Freezing, Ultra High Pressure Treatment, Glow Discharge Plasma Treatment, Osmotic-Pressure Treatment, Thermal Inhibition and Gelatinization; Chemical modifications: Etherification & Esterification,Cross-Linking,Acid Treatment,Oxidation,Dual Modification; Enzymatic Modifications; Genetic Modification.
Modified starch market – By Application: Thickeners, Stabilizers, Binders, Emulsifiers.
Modified starch market – By End-User industry: Food & Beverages: Frozen food, Flavor Encapsulation, Dairy Products, Canned foods; Pharmaceuticals: Pharmaceutical excipient, Tablet Superdieintegrant, Controlled/Sustained release polymer, Plasma volume expander; Cosmetics: Creams & Lotions, Anhydrous Products, Antiperspirants, Color cosmetics, Cleansing Products, Dry Shampoos, Powders; Animal Feed: Aquaculture, Beef Cattle, Compound feed, Bulk ingredient for On-farm Formulation, Pet food; Paper Industry, Petroleum Industry, Plastic Industry, Textile Industry, Others.
The Modified starch market report also analyzes the major geographic regions for the market as well as the major countries for the market in these regions. The regions and countries covered in the study include:
- North America: The U.S., Canada, Mexico
- South America: Brazil, Venezuela, Argentina, Ecuador, Peru, Colombia, Costa Rica
- Europe: The U.K., Germany, Italy, France, The Netherlands, Belgium, Spain, Denmark
- APAC: China, Japan, Australia, South Korea, India, Taiwan, Malaysia, Hong Kong
- Middle East and Africa: Israel, South Africa, Saudi Arabia
Modified starch market Key Players Perspective:
Some of the Key players in this market that have been studied for this report include: Archer Daniels Midland Company, Cargill, Ingredion Incorporated, Tate & Lyle PLC, Roquette Frères, Avebe U. A., Grain Processing Corporation, Emsland- Stärke GmbH, Agrana Beteiligungs-AG, Sms Corporation Co. Ltd, Global Bio-Chem Technology Group Company Limited, Spac Starch Products Ltd. and Qingdao Cbh Co.Ltd.
“As global demand for healthier and tastier food continues to grow, this business has the opportunity to deliver meaningful benefits for our customers, employees, shareholders, and society at large, in the years ahead.” Nick Hampton, chief executive, Tate & Lyle
Market Research and Market Trends of Modified starch market:
- Archer Daniels Midland Company has introduced new tapioca starch ingredients in partnership with Vedan international. These new ingredients will help in improving the stability by binding water in food systems.
- Ingredion has launched a new modified food starch for yield improvement in cheese products. The new starch solution named PRECISA 680 is based on waxy maize. It is reported that the new starch solution can increase the yield by 8% to 10% in cheese manufacturing.
- Tate & Lyle has received verification for 18 Starch Ingredients. These new starches will help in tackling formulation challenges which will deliver their texture goals. Texture is seen as one of the big challenges for formulators to optimize.
- Ingredion has announced 17 additions to its wide range of non-GMO ingredient solutions. These newly added modified starch solutions helping in in improving process tolerance and stability in application related to food and beverage industry.
Key Market Players:
The Top 5 companies in the Modified Starch Market are:
- Roquette Freres
- Tate & Lyle
- Cargill
- Ingredion
- ADM
For more Food and Beverage Market reports, please click here
1. Modified starch market - Overview
1.1. Definitions and Scope
2. Modified starch market - Executive summary
2.1. Market Revenue, Market Size and Key Trends by Company
2.2. Key Trends by type of Application
2.3. Key Trends segmented by Geography
3. Modified starch market
3.1. Comparative analysis
3.1.1. Product Benchmarking - Top 10 companies
3.1.2. Top 5 Financials Analysis
3.1.3. Market Value split by Top 10 companies
3.1.4. Patent Analysis - Top 10 companies
3.1.5. Pricing Analysis
4. Modified starch market Forces
4.1. Drivers
4.2. Constraints
4.3. Challenges
4.4. Porters five force model
4.4.1. Bargaining power of suppliers
4.4.2. Bargaining powers of customers
4.4.3. Threat of new entrants
4.4.4. Rivalry among existing players
4.4.5. Threat of substitutes
5. Modified starch market -Strategic analysis
5.1. Value chain analysis
5.2. Opportunities analysis
5.3. Product life cycle
6. Modified starch market– By types of modified starch (Market Size -$Million / $Billion)
6.1. Segment type Size and Market Share Analysis
6.2. Application Revenue and Trends by type of Application
6.3. Application Segment Analysis by Type
6.3.1. Pregelatinized Starch
6.3.2. Cross-Linked Starch
6.3.3. Oxidized Starch
6.3.4. Cationic Starch
6.3.5. Anionic Starch
6.3.6. Thinned Starch
6.3.7. Acetylated Starch
6.3.8. Dextrins
6.3.9. Grafted Starch
6.3.10. Ethers Starch
6.3.11. Physically Modified Starch
6.3.12. Enzyme Modified Starch
7. Modified starch market– By functions (Market Size -$Million / $Billion)
7.1. Thickeners
7.2. Stabilizers
7.3. Binders
7.4. Emulsifiers
8. Modified starch market – By End User Industry (Market Size -$Million / $Billion)
8.1. Market Size and Market Share Analysis
8.2. Application Revenue and Trend Research
8.3. Product Segment Analysis
8.3.1. Food & Beverages
8.3.1.1. Frozen food
8.3.1.2. Flavor Encapsulation
8.3.1.3. Dairy Products
8.3.1.4. Canned foods
8.3.2. Pharmaceuticals
8.3.2.1. Pharmaceutical excipient
8.3.2.2. Tablet Superdisintegrant
8.3.2.3. Controlled/Sustained release polymer
8.3.2.4. Plasma volume expander
8.3.3. Cosmetics
8.3.3.1. Creams & Lotions
8.3.3.2. Anhydrous Products
8.3.3.3. Antiperspirants
8.3.3.4. Color cosmetics
8.3.3.5. Cleansing Products
8.3.3.6. Dry Shampoos
8.3.3.7. Powders
8.3.4. Animal Feed
8.3.4.1. Aquaculture
8.3.4.2. Beef Cattle
8.3.4.3. Compound feed
8.3.4.4. Bulk ingredient for On-farm Formulation
8.3.4.5. Pet food
8.3.5. Paper Industry
8.3.6. Petroleum Industry
8.3.7. Plastic Industry
8.3.8. Textile Industry
9. Modified starch market – By raw materials (Market Size -$Million / $Billion)
9.1. Corn
9.2. cassava
9.3. Potato
9.4. Wheat
9.5. Others
10. Modified starch market – By Production methods (Market Size -$Million / $Billion)
10.1. Physical Modifications
10.1.1. Heat–moisture treatment
10.1.2. Annealing
10.1.3. Retrogradation
10.1.4. Freezing
10.1.5. Ultra High Pressure Treatment
10.1.6. Glow Discharge Plasma Treatment
10.1.7. Osmotic-Pressure Treatment
10.1.8. Thermal Inhibition
10.1.9. Gelatinization
10.2. Chemical Modifications
10.2.1. Etherification & Esterification
10.2.2. Cross-Linking
10.2.3. Acid Treatment
10.2.4. Oxidation
10.2.5. Dual Modification
10.3. Enzymatic Modification
10.4. Genetic Modification
11. Modified starch - By Geography (Market Size -$Million / $Billion)
11.1. Modified starch Market - North America Segment Research
11.2. North America Market Research (Million / $Billion)
11.2.1. Segment type Size and Market Size Analysis
11.2.2. Revenue and Trends
11.2.3. Application Revenue and Trends by type of Application
11.2.4. Company Revenue and Product Analysis
11.2.5. North America Product type and Application Market Size
11.2.5.1. U.S.
11.2.5.2. Canada
11.2.5.3. Mexico
11.2.5.4. Rest of North America
11.3. Modified starch - South America Segment Research
11.4. South America Market Research (Market Size -$Million / $Billion)
11.4.1. Segment type Size and Market Size Analysis
11.4.2. Revenue and Trends
11.4.3. Application Revenue and Trends by type of Application
11.4.4. Company Revenue and Product Analysis
11.4.5. South America Product type and Application Market Size
11.4.5.1. Brazil
11.4.5.2. Venezuela
11.4.5.3. Argentina
11.4.5.4. Ecuador
11.4.5.5. Peru
11.4.5.6. Colombia
11.4.5.7. Costa Rica
11.4.5.8. Rest of South America
11.5. Modified starch - Europe Segment Research
11.6. Europe Market Research (Market Size -$Million / $Billion)
11.6.1. Segment type Size and Market Size Analysis
11.6.2. Revenue and Trends
11.6.3. Application Revenue and Trends by type of Application
11.6.4. Company Revenue and Product Analysis
11.6.5. Europe Segment Product type and Application Market Size
11.6.5.1. U.K
11.6.5.2. Germany
11.6.5.3. Italy
11.6.5.4. France
11.6.5.5. Netherlands
11.6.5.6. Belgium
11.6.5.7. Spain
11.6.5.8. Denmark
11.6.5.9. Rest of Europe
11.7. Modified starch – APAC Segment Research
11.8. APAC Market Research (Market Size -$Million / $Billion)
11.8.1. Segment type Size and Market Size Analysis
11.8.2. Revenue and Trends
11.8.3. Application Revenue and Trends by type of Application
11.8.4. Company Revenue and Product Analysis
11.8.5. APAC Segment – Product type and Application Market Size
11.8.5.1. China
11.8.5.2. Australia
11.8.5.3. Japan
11.8.5.4. South Korea
11.8.5.5. India
11.8.5.6. Taiwan
11.8.5.7. Malaysia
12. Modified starch Market - Entropy
12.1. New product launches
12.2. M&A's, collaborations, JVs and partnerships
13. Modified starch Market – Industry / Segment Competition landscape Premium
13.1. Market Share Analysis
13.1.1. Market Share by Country- Top companies
13.1.2. Market Share by Region- Top 10 companies
13.1.3. Market Share by type of Application – Top 10 companies
13.1.4. Market Share by type of Product / Product category- Top 10 companies
13.1.5. Market Share at global level- Top 10 companies
13.1.6. Best Practises for companies
14. Modified starch Market – Key Company List by Country Premium
15. Modified starch Market Company Analysis
15.1. Market Share, Company Revenue, Products, M&A, Developments
15.2. Archer Daniels Midland Company
15.3. Cargill
15.4. Ingredion Incorporated
15.5. Tate & Lyle PLC
15.6. Roquette Frères
15.7. Avebe U. A.
15.8. Grain Processing Corporation
15.9. Emsland- Stärke GmbH
15.10. Agrana Beteiligungs-AG
15.11. Sms Corporation Co. Ltd
15.12. Global Bio-Chem Technology Group Company Limited
15.13. Company 12
15.14. Company 13
15.15. Company 14 and more
"*Financials would be provided on a best efforts basis for private companies"
16. Modified starch Market -Appendix
16.1. Abbreviations
16.2. Sources
17. Modified starch Market -Methodology Premium
17.1. Research Methodology
17.1.1. Company Expert Interviews
17.1.2. Industry Databases
17.1.3. Associations
17.1.4. Company News
17.1.5. Company Annual Reports
17.1.6. Application Trends
17.1.7. New Products and Product database
17.1.8. Company Transcripts
17.1.9. R&D Trends
17.1.10. Key Opinion Leaders Interviews
17.1.11. Supply and Demand Trends
List of Tables:
Table 1: Modified Starch Market Overview 2023-2030
Table 2: Modified Starch Market Leader Analysis 2023-2024 (US$)
Table 3: Modified Starch Market Product Analysis 2023-2024 (US$)
Table 4: Modified Starch Market End User Analysis 2023-2024 (US$)
Table 5: Modified Starch Market Patent Analysis 2021-2023* (US$)
Table 6: Modified Starch Market Financial Analysis 2023-2024 (US$)
Table 7: Modified Starch Market Driver Analysis 2023-2024 (US$)
Table 8: Modified Starch Market Challenges Analysis 2023-2024 (US$)
Table 9: Modified Starch Market Constraint Analysis 2023-2024 (US$)
Table 10: Modified Starch Market Supplier Bargaining Power Analysis 2023-2024 (US$)
Table 11: Modified Starch Market Buyer Bargaining Power Analysis 2023-2024 (US$)
Table 12: Modified Starch Market Threat of Substitutes Analysis 2023-2024 (US$)
Table 13: Modified Starch Market Threat of New Entrants Analysis 2023-2024 (US$)
Table 14: Modified Starch Market Degree of Competition Analysis 2023-2024 (US$)
Table 15: Modified Starch Market Value Chain Analysis 2023-2024 (US$)
Table 16: Modified Starch Market Pricing Analysis 2023-2030 (US$)
Table 17: Modified Starch Market Opportunities Analysis 2023-2030 (US$)
Table 18: Modified Starch Market Product Life Cycle Analysis 2023-2030 (US$)
Table 19: Modified Starch Market Supplier Analysis 2023-2024 (US$)
Table 20: Modified Starch Market Distributor Analysis 2023-2024 (US$)
Table 21: Modified Starch Market Trend Analysis 2023-2024 (US$)
Table 22: Modified Starch Market Size 2023 (US$)
Table 23: Modified Starch Market Forecast Analysis 2023-2030 (US$)
Table 24: Modified Starch Market Sales Forecast Analysis 2023-2030 (Units)
Table 25: Modified Starch Market, Revenue & Volume, By Type, 2023-2030 ($)
Table 26: Modified Starch Market By Type, Revenue & Volume, By Pregelatinized Starch, 2023-2030 ($)
Table 27: Modified Starch Market By Type, Revenue & Volume, By Cross-Linked Starch, 2023-2030 ($)
Table 28: Modified Starch Market By Type, Revenue & Volume, By Oxidized Starch, 2023-2030 ($)
Table 29: Modified Starch Market By Type, Revenue & Volume, By Cationic Starch, 2023-2030 ($)
Table 30: Modified Starch Market By Type, Revenue & Volume, By Anionic Starch, 2023-2030 ($)
Table 31: Modified Starch Market, Revenue & Volume, By Product & Services, 2023-2030 ($)
Table 32: Modified Starch Market By Product & Services, Revenue & Volume, By Exchanging & Trading, 2023-2030 ($)
Table 33: Modified Starch Market By Product & Services, Revenue & Volume, By Financial Services, 2023-2030 ($)
Table 34: Modified Starch Market By Product & Services, Revenue & Volume, By Infrastructure, 2023-2030 ($)
Table 35: Modified Starch Market By Product & Services, Revenue & Volume, By Payments & E-Wallets, 2023-2030 ($)
Table 36: Modified Starch Market By Product & Services, Revenue & Volume, By Digital Identity & Reputation, 2023-2030 ($)
Table 37: Modified Starch Market, Revenue & Volume, By Function, 2023-2030 ($)
Table 38: Modified Starch Market By Function, Revenue & Volume, By Thickening, 2023-2030 ($)
Table 39: Modified Starch Market By Function, Revenue & Volume, By Stabilizing, 2023-2030 ($)
Table 40: Modified Starch Market By Function, Revenue & Volume, By Emulsifying, 2023-2030 ($)
Table 41: Modified Starch Market By Function, Revenue & Volume, By Binding, 2023-2030 ($)
Table 42: Modified Starch Market, Revenue & Volume, By Application, 2023-2030 ($)
Table 43: Modified Starch Market By Application, Revenue & Volume, By Food & Beverages, 2023-2030 ($)
Table 44: Modified Starch Market By Application, Revenue & Volume, By Pharmaceuticals, 2023-2030 ($)
Table 45: Modified Starch Market By Application, Revenue & Volume, By Cosmetics, 2023-2030 ($)
Table 46: Modified Starch Market By Application, Revenue & Volume, By Animal Feed, 2023-2030 ($)
Table 47: Modified Starch Market By Application, Revenue & Volume, By Paper Industry, 2023-2030 ($)
Table 48: Modified Starch Market, Revenue & Volume, By Raw Materials, 2023-2030 ($)
Table 49: Modified Starch Market By Raw Materials, Revenue & Volume, By Corn, 2023-2030 ($)
Table 50: Modified Starch Market By Raw Materials, Revenue & Volume, By Tapioca, 2023-2030 ($)
Table 51: Modified Starch Market By Raw Materials, Revenue & Volume, By Potato, 2023-2030 ($)
Table 52: Modified Starch Market By Raw Materials, Revenue & Volume, By Wheat, 2023-2030 ($)
Table 53: North America Modified Starch Market, Revenue & Volume, By Type, 2023-2030 ($)
Table 54: North America Modified Starch Market, Revenue & Volume, By Product & Services, 2023-2030 ($)
Table 55: North America Modified Starch Market, Revenue & Volume, By Function, 2023-2030 ($)
Table 56: North America Modified Starch Market, Revenue & Volume, By Application, 2023-2030 ($)
Table 57: North America Modified Starch Market, Revenue & Volume, By Raw Materials, 2023-2030 ($)
Table 58: South america Modified Starch Market, Revenue & Volume, By Type, 2023-2030 ($)
Table 59: South america Modified Starch Market, Revenue & Volume, By Product & Services, 2023-2030 ($)
Table 60: South america Modified Starch Market, Revenue & Volume, By Function, 2023-2030 ($)
Table 61: South america Modified Starch Market, Revenue & Volume, By Application, 2023-2030 ($)
Table 62: South america Modified Starch Market, Revenue & Volume, By Raw Materials, 2023-2030 ($)
Table 63: Europe Modified Starch Market, Revenue & Volume, By Type, 2023-2030 ($)
Table 64: Europe Modified Starch Market, Revenue & Volume, By Product & Services, 2023-2030 ($)
Table 65: Europe Modified Starch Market, Revenue & Volume, By Function, 2023-2030 ($)
Table 66: Europe Modified Starch Market, Revenue & Volume, By Application, 2023-2030 ($)
Table 67: Europe Modified Starch Market, Revenue & Volume, By Raw Materials, 2023-2030 ($)
Table 68: APAC Modified Starch Market, Revenue & Volume, By Type, 2023-2030 ($)
Table 69: APAC Modified Starch Market, Revenue & Volume, By Product & Services, 2023-2030 ($)
Table 70: APAC Modified Starch Market, Revenue & Volume, By Function, 2023-2030 ($)
Table 71: APAC Modified Starch Market, Revenue & Volume, By Application, 2023-2030 ($)
Table 72: APAC Modified Starch Market, Revenue & Volume, By Raw Materials, 2023-2030 ($)
Table 73: Middle East & Africa Modified Starch Market, Revenue & Volume, By Type, 2023-2030 ($)
Table 74: Middle East & Africa Modified Starch Market, Revenue & Volume, By Product & Services, 2023-2030 ($)
Table 75: Middle East & Africa Modified Starch Market, Revenue & Volume, By Function, 2023-2030 ($)
Table 76: Middle East & Africa Modified Starch Market, Revenue & Volume, By Application, 2023-2030 ($)
Table 77: Middle East & Africa Modified Starch Market, Revenue & Volume, By Raw Materials, 2023-2030 ($)
Table 78: Russia Modified Starch Market, Revenue & Volume, By Type, 2023-2030 ($)
Table 79: Russia Modified Starch Market, Revenue & Volume, By Product & Services, 2023-2030 ($)
Table 80: Russia Modified Starch Market, Revenue & Volume, By Function, 2023-2030 ($)
Table 81: Russia Modified Starch Market, Revenue & Volume, By Application, 2023-2030 ($)
Table 82: Russia Modified Starch Market, Revenue & Volume, By Raw Materials, 2023-2030 ($)
Table 83: Israel Modified Starch Market, Revenue & Volume, By Type, 2023-2030 ($)
Table 84: Israel Modified Starch Market, Revenue & Volume, By Product & Services, 2023-2030 ($)
Table 85: Israel Modified Starch Market, Revenue & Volume, By Function, 2023-2030 ($)
Table 86: Israel Modified Starch Market, Revenue & Volume, By Application, 2023-2030 ($)
Table 87: Israel Modified Starch Market, Revenue & Volume, By Raw Materials, 2023-2030 ($)
Table 88: Top Companies 2023 (US$) Modified Starch Market, Revenue & Volume
Table 89: Product Launch 2023-2024 Modified Starch Market, Revenue & Volume
Table 90: Mergers & Acquistions 2023-2024 Modified Starch Market, Revenue & Volume
List of Figures:
Figure 1: Overview of Modified Starch Market 2023-2030
Figure 2: Market Share Analysis for Modified Starch Market 2023 (US$)
Figure 3: Product Comparison in Modified Starch Market 2023-2024 (US$)
Figure 4: End User Profile for Modified Starch Market 2023-2024 (US$)
Figure 5: Patent Application and Grant in Modified Starch Market 2021-2023* (US$)
Figure 6: Top 5 Companies Financial Analysis in Modified Starch Market 2023-2024 (US$)
Figure 7: Market Entry Strategy in Modified Starch Market 2023-2024
Figure 8: Ecosystem Analysis in Modified Starch Market 2023
Figure 9: Average Selling Price in Modified Starch Market 2023-2030
Figure 10: Top Opportunites in Modified Starch Market 2023-2024
Figure 11: Market Life Cycle Analysis in Modified Starch Market
Figure 12: GlobalBy Type Modified Starch Market Revenue, 2023-2030 ($)
Figure 13: GlobalBy Product & Services Modified Starch Market Revenue, 2023-2030 ($)
Figure 14: GlobalBy Function Modified Starch Market Revenue, 2023-2030 ($)
Figure 15: GlobalBy Application Modified Starch Market Revenue, 2023-2030 ($)
Figure 16: GlobalBy Raw Materials Modified Starch Market Revenue, 2023-2030 ($)
Figure 17: Global Modified Starch Market - By Geography
Figure 18: Global Modified Starch Market Value & Volume, By Geography, 2023-2030 ($)
Figure 19: Global Modified Starch Market CAGR, By Geography, 2023-2030 (%)
Figure 20: North America Modified Starch Market Value & Volume, 2023-2030 ($)
Figure 21: US Modified Starch Market Value & Volume, 2023-2030 ($)
Figure 22: US GDP and Population, 2023-2024 ($)
Figure 23: US GDP – Composition of 2023, By Sector of Origin
Figure 24: US Export and Import Value & Volume, 2023-2024 ($)
Figure 25: Canada Modified Starch Market Value & Volume, 2023-2030 ($)
Figure 26: Canada GDP and Population, 2023-2024 ($)
Figure 27: Canada GDP – Composition of 2023, By Sector of Origin
Figure 28: Canada Export and Import Value & Volume, 2023-2024 ($)
Figure 29: Mexico Modified Starch Market Value & Volume, 2023-2030 ($)
Figure 30: Mexico GDP and Population, 2023-2024 ($)
Figure 31: Mexico GDP – Composition of 2023, By Sector of Origin
Figure 32: Mexico Export and Import Value & Volume, 2023-2024 ($)
Figure 33: South America Modified Starch Market Value & Volume, 2023-2030 ($)
Figure 34: Brazil Modified Starch Market Value & Volume, 2023-2030 ($)
Figure 35: Brazil GDP and Population, 2023-2024 ($)
Figure 36: Brazil GDP – Composition of 2023, By Sector of Origin
Figure 37: Brazil Export and Import Value & Volume, 2023-2024 ($)
Figure 38: Venezuela Modified Starch Market Value & Volume, 2023-2030 ($)
Figure 39: Venezuela GDP and Population, 2023-2024 ($)
Figure 40: Venezuela GDP – Composition of 2023, By Sector of Origin
Figure 41: Venezuela Export and Import Value & Volume, 2023-2024 ($)
Figure 42: Argentina Modified Starch Market Value & Volume, 2023-2030 ($)
Figure 43: Argentina GDP and Population, 2023-2024 ($)
Figure 44: Argentina GDP – Composition of 2023, By Sector of Origin
Figure 45: Argentina Export and Import Value & Volume, 2023-2024 ($)
Figure 46: Ecuador Modified Starch Market Value & Volume, 2023-2030 ($)
Figure 47: Ecuador GDP and Population, 2023-2024 ($)
Figure 48: Ecuador GDP – Composition of 2023, By Sector of Origin
Figure 49: Ecuador Export and Import Value & Volume, 2023-2024 ($)
Figure 50: Peru Modified Starch Market Value & Volume, 2023-2030 ($)
Figure 51: Peru GDP and Population, 2023-2024 ($)
Figure 52: Peru GDP – Composition of 2023, By Sector of Origin
Figure 53: Peru Export and Import Value & Volume, 2023-2024 ($)
Figure 54: Colombia Modified Starch Market Value & Volume, 2023-2030 ($)
Figure 55: Colombia GDP and Population, 2023-2024 ($)
Figure 56: Colombia GDP – Composition of 2023, By Sector of Origin
Figure 57: Colombia Export and Import Value & Volume, 2023-2024 ($)
Figure 58: Costa Rica Modified Starch Market Value & Volume, 2023-2030 ($)
Figure 59: Costa Rica GDP and Population, 2023-2024 ($)
Figure 60: Costa Rica GDP – Composition of 2023, By Sector of Origin
Figure 61: Costa Rica Export and Import Value & Volume, 2023-2024 ($)
Figure 62: Europe Modified Starch Market Value & Volume, 2023-2030 ($)
Figure 63: U.K Modified Starch Market Value & Volume, 2023-2030 ($)
Figure 64: U.K GDP and Population, 2023-2024 ($)
Figure 65: U.K GDP – Composition of 2023, By Sector of Origin
Figure 66: U.K Export and Import Value & Volume, 2023-2024 ($)
Figure 67: Germany Modified Starch Market Value & Volume, 2023-2030 ($)
Figure 68: Germany GDP and Population, 2023-2024 ($)
Figure 69: Germany GDP – Composition of 2023, By Sector of Origin
Figure 70: Germany Export and Import Value & Volume, 2023-2024 ($)
Figure 71: Italy Modified Starch Market Value & Volume, 2023-2030 ($)
Figure 72: Italy GDP and Population, 2023-2024 ($)
Figure 73: Italy GDP – Composition of 2023, By Sector of Origin
Figure 74: Italy Export and Import Value & Volume, 2023-2024 ($)
Figure 75: France Modified Starch Market Value & Volume, 2023-2030 ($)
Figure 76: France GDP and Population, 2023-2024 ($)
Figure 77: France GDP – Composition of 2023, By Sector of Origin
Figure 78: France Export and Import Value & Volume, 2023-2024 ($)
Figure 79: Netherlands Modified Starch Market Value & Volume, 2023-2030 ($)
Figure 80: Netherlands GDP and Population, 2023-2024 ($)
Figure 81: Netherlands GDP – Composition of 2023, By Sector of Origin
Figure 82: Netherlands Export and Import Value & Volume, 2023-2024 ($)
Figure 83: Belgium Modified Starch Market Value & Volume, 2023-2030 ($)
Figure 84: Belgium GDP and Population, 2023-2024 ($)
Figure 85: Belgium GDP – Composition of 2023, By Sector of Origin
Figure 86: Belgium Export and Import Value & Volume, 2023-2024 ($)
Figure 87: Spain Modified Starch Market Value & Volume, 2023-2030 ($)
Figure 88: Spain GDP and Population, 2023-2024 ($)
Figure 89: Spain GDP – Composition of 2023, By Sector of Origin
Figure 90: Spain Export and Import Value & Volume, 2023-2024 ($)
Figure 91: Denmark Modified Starch Market Value & Volume, 2023-2030 ($)
Figure 92: Denmark GDP and Population, 2023-2024 ($)
Figure 93: Denmark GDP – Composition of 2023, By Sector of Origin
Figure 94: Denmark Export and Import Value & Volume, 2023-2024 ($)
Figure 95: APAC Modified Starch Market Value & Volume, 2023-2030 ($)
Figure 96: China Modified Starch Market Value & Volume, 2023-2030
Figure 97: China GDP and Population, 2023-2024 ($)
Figure 98: China GDP – Composition of 2023, By Sector of Origin
Figure 99: China Export and Import Value & Volume, 2023-2024 ($) Modified Starch Market China Export and Import Value & Volume, 2023-2024 ($)
Figure 100: Australia Modified Starch Market Value & Volume, 2023-2030 ($)
Figure 101: Australia GDP and Population, 2023-2024 ($)
Figure 102: Australia GDP – Composition of 2023, By Sector of Origin
Figure 103: Australia Export and Import Value & Volume, 2023-2024 ($)
Figure 104: South Korea Modified Starch Market Value & Volume, 2023-2030 ($)
Figure 105: South Korea GDP and Population, 2023-2024 ($)
Figure 106: South Korea GDP – Composition of 2023, By Sector of Origin
Figure 107: South Korea Export and Import Value & Volume, 2023-2024 ($)
Figure 108: India Modified Starch Market Value & Volume, 2023-2030 ($)
Figure 109: India GDP and Population, 2023-2024 ($)
Figure 110: India GDP – Composition of 2023, By Sector of Origin
Figure 111: India Export and Import Value & Volume, 2023-2024 ($)
Figure 112: Taiwan Modified Starch Market Value & Volume, 2023-2030 ($)
Figure 113: Taiwan GDP and Population, 2023-2024 ($)
Figure 114: Taiwan GDP – Composition of 2023, By Sector of Origin
Figure 115: Taiwan Export and Import Value & Volume, 2023-2024 ($)
Figure 116: Malaysia Modified Starch Market Value & Volume, 2023-2030 ($)
Figure 117: Malaysia GDP and Population, 2023-2024 ($)
Figure 118: Malaysia GDP – Composition of 2023, By Sector of Origin
Figure 119: Malaysia Export and Import Value & Volume, 2023-2024 ($)
Figure 120: Hong Kong Modified Starch Market Value & Volume, 2023-2030 ($)
Figure 121: Hong Kong GDP and Population, 2023-2024 ($)
Figure 122: Hong Kong GDP – Composition of 2023, By Sector of Origin
Figure 123: Hong Kong Export and Import Value & Volume, 2023-2024 ($)
Figure 124: Middle East & Africa Modified Starch Market Middle East & Africa 3D Printing Market Value & Volume, 2023-2030 ($)
Figure 125: Russia Modified Starch Market Value & Volume, 2023-2030 ($)
Figure 126: Russia GDP and Population, 2023-2024 ($)
Figure 127: Russia GDP – Composition of 2023, By Sector of Origin
Figure 128: Russia Export and Import Value & Volume, 2023-2024 ($)
Figure 129: Israel Modified Starch Market Value & Volume, 2023-2030 ($)
Figure 130: Israel GDP and Population, 2023-2024 ($)
Figure 131: Israel GDP – Composition of 2023, By Sector of Origin
Figure 132: Israel Export and Import Value & Volume, 2023-2024 ($)
Figure 133: Entropy Share, By Strategies, 2023-2024* (%) Modified Starch Market
Figure 134: Developments, 2023-2024* Modified Starch Market
Figure 135: Company 1 Modified Starch Market Net Revenue, By Years, 2023-2024* ($)
Figure 136: Company 1 Modified Starch Market Net Revenue Share, By Business segments, 2023 (%)
Figure 137: Company 1 Modified Starch Market Net Sales Share, By Geography, 2023 (%)
Figure 138: Company 2 Modified Starch Market Net Revenue, By Years, 2023-2024* ($)
Figure 139: Company 2 Modified Starch Market Net Revenue Share, By Business segments, 2023 (%)
Figure 140: Company 2 Modified Starch Market Net Sales Share, By Geography, 2023 (%)
Figure 141: Company 3 Modified Starch Market Net Revenue, By Years, 2023-2024* ($)
Figure 142: Company 3 Modified Starch Market Net Revenue Share, By Business segments, 2023 (%)
Figure 143: Company 3 Modified Starch Market Net Sales Share, By Geography, 2023 (%)
Figure 144: Company 4 Modified Starch Market Net Revenue, By Years, 2023-2024* ($)
Figure 145: Company 4 Modified Starch Market Net Revenue Share, By Business segments, 2023 (%)
Figure 146: Company 4 Modified Starch Market Net Sales Share, By Geography, 2023 (%)
Figure 147: Company 5 Modified Starch Market Net Revenue, By Years, 2023-2024* ($)
Figure 148: Company 5 Modified Starch Market Net Revenue Share, By Business segments, 2023 (%)
Figure 149: Company 5 Modified Starch Market Net Sales Share, By Geography, 2023 (%)
Figure 150: Company 6 Modified Starch Market Net Revenue, By Years, 2023-2024* ($)
Figure 151: Company 6 Modified Starch Market Net Revenue Share, By Business segments, 2023 (%)
Figure 152: Company 6 Modified Starch Market Net Sales Share, By Geography, 2023 (%)
Figure 153: Company 7 Modified Starch Market Net Revenue, By Years, 2023-2024* ($)
Figure 154: Company 7 Modified Starch Market Net Revenue Share, By Business segments, 2023 (%)
Figure 155: Company 7 Modified Starch Market Net Sales Share, By Geography, 2023 (%)
Figure 156: Company 8 Modified Starch Market Net Revenue, By Years, 2023-2024* ($)
Figure 157: Company 8 Modified Starch Market Net Revenue Share, By Business segments, 2023 (%)
Figure 158: Company 8 Modified Starch Market Net Sales Share, By Geography, 2023 (%)
Figure 159: Company 9 Modified Starch Market Net Revenue, By Years, 2023-2024* ($)
Figure 160: Company 9 Modified Starch Market Net Revenue Share, By Business segments, 2023 (%)
Figure 161: Company 9 Modified Starch Market Net Sales Share, By Geography, 2023 (%)
Figure 162: Company 10 Modified Starch Market Net Revenue, By Years, 2023-2024* ($)
Figure 163: Company 10 Modified Starch Market Net Revenue Share, By Business segments, 2023 (%)
Figure 164: Company 10 Modified Starch Market Net Sales Share, By Geography, 2023 (%)
Figure 165: Company 11 Modified Starch Market Net Revenue, By Years, 2023-2024* ($)
Figure 166: Company 11 Modified Starch Market Net Revenue Share, By Business segments, 2023 (%)
Figure 167: Company 11 Modified Starch Market Net Sales Share, By Geography, 2023 (%)
Figure 168: Company 12 Modified Starch Market Net Revenue, By Years, 2023-2024* ($)
Figure 169: Company 12 Modified Starch Market Net Revenue Share, By Business segments, 2023 (%)
Figure 170: Company 12 Modified Starch Market Net Sales Share, By Geography, 2023 (%)
Figure 171: Company 13 Modified Starch Market Net Revenue, By Years, 2023-2024* ($)
Figure 172: Company 13 Modified Starch Market Net Revenue Share, By Business segments, 2023 (%)
Figure 173: Company 13 Modified Starch Market Net Sales Share, By Geography, 2023 (%)
Figure 174: Company 14 Modified Starch Market Net Revenue, By Years, 2023-2024* ($)
Figure 175: Company 14 Modified Starch Market Net Revenue Share, By Business segments, 2023 (%)
Figure 176: Company 14 Modified Starch Market Net Sales Share, By Geography, 2023 (%)
Figure 177: Company 15 Modified Starch Market Net Revenue, By Years, 2023-2024* ($)
Figure 178: Company 15 Modified Starch Market Net Revenue Share, By Business segments, 2023 (%)
Figure 179: Company 15 Modified Starch Market Net Sales Share, By Geography, 2023 (%)